
Page Last Updated: 23 October 2024
|
|
Page Last Updated: 23 October 2024 |
| ID | Elevation of Instrument in Gage Height |
Elevation of Instrument in Datum |
Period |
| 8007 | 1.90 feet | 1,406.90 feet NAVD88 | 03/03/2022 -- Current |
| STATUS | Active |
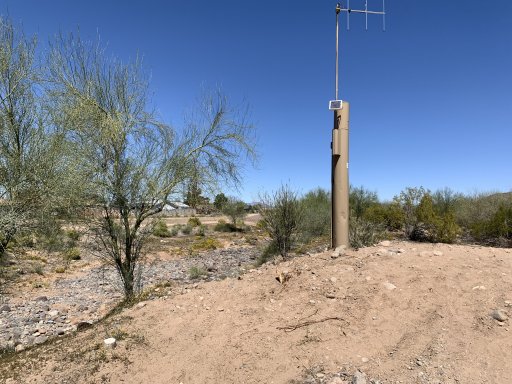
| LOCATION | Located about a quarter mile north of Union Hills Drive |
| DRAINAGE AREA | 7.1 mi2 |
| STREAM TYPE | Natural |
| JURISDICTION | Phoenix, Arizona |
| WATERSHED | Upper ACDC |
| SECTION/TOWNSHIP/RANGE | S29 T4N R3E |
| LATITUDE | N 33° 39' 31.9" | +33.65885 |
| LONGITUDE | W 112° 04' 29.0" | -112.07472 |
| ARIZONA STATE PLANE | E 651910 | N 967290 |
| USGS QUAD SHEET | Union Hills 7.5-Minute |
| STREAMGAGE INSTALLATION DATE | 03/03/2022 - WY 2022 |
| PERIOD OF AVAILABLE DATA RECORD | 03/03/2022 - Current |
| LENGTH OF AVAILABLE DATA RECORD (AS OF 10/01/2024) | 2.58 Years | 943 Days |
| GAPS (> 2 DAYS) IN RECORD | None |
| STAGE GAGE TYPE | Pressure Transducer |
| STAGE GAGE ELEVATION | 1.90 feet Gage Height |
| STAFF GAGES | None |
| CREST STAGE GAGES | 1 |
| ZERO GAGE HEIGHT ELEVATION | 1,405.000 feet NAVD88 |
| POINT OF ZERO FLOW | 0.5 feet Gage Height |
| EXTREME FOR PERIOD OF RECORD | 248 cfs | 2.48 feet | 07/30/2022 |
| Current Rating = #1 - Applied since 03/03/2022 | ||
| Discharge (cfs) |
Elevation feet Gage Height |
Elevation feet NAVD88 |
| 0 | 0.00 | 1,405.00 |
| 100 | 1.70 | 1,406.70 |
| 200 | 2.27 | 1,407.27 |
| 300 | 2.69 | 1,407.69 |
| 500 | 3.34 | 1,408.34 |
| 800 | 4.07 | 1,409.07 |
| 1,000 | 4.49 | 1,409.49 |
| 2,000 | 6.24 | 1,411.24 |
| Water Year |
Peak Gage Height (feet) |
Peak Discharge (cfs) |
Date of Peak |
| 2025 | |||
| 2024 | None | 0 | None |
| 2023 | 2.38 | 224 | 03/23/2023 |
| 2022 (partial) | 2.48 | 248 | 08/19/2022 |
| Date of Peak |
Time of Peak |
Runoff Start |
Runoff End |
Duration (hours) |
Peak Stage (feet GH) |
Peak Discharge (CFS) |
Water Year |
| View a Plot of These Data | |||||||
| 03/23/2023 | 06:00 | 03/22/2023 18:00 | 03/25/2023 12:00 | 66.0 | 2.38 | 224 | 2023 |
| 07/30/2022 | 20:00 | 07/30/2022 19:18 | 07/20/2022 21:01 | 1.7 | 2.48 | 248 | 2022 |
| Crest Gage Number | Pin Elevation (Feet, Gage Height) |
Additional Information |
| 1 | 2.05 | Located on left bank near transducer gage |