Page Last Updated: 23 October 2024
|
|
Page Last Updated: 23 October 2024 |
| ID | Elevation of Instrument in Gage Height |
Elevation of Instrument in Datum |
Period |
| 68707 | 1.69 feet | 1,304.59 feet NAVD88 | 04/24/2020 -- Current |
| 6523 | 1.69 feet | 1,304.59 feet NAVD88 | 10/01/2017 -- 04/24/2020 |
| 6523 | 1.69 feet | 1.69 feet Gage Height | 04/15/2014 -- 09/30/2017 |
| STATUS | Active |
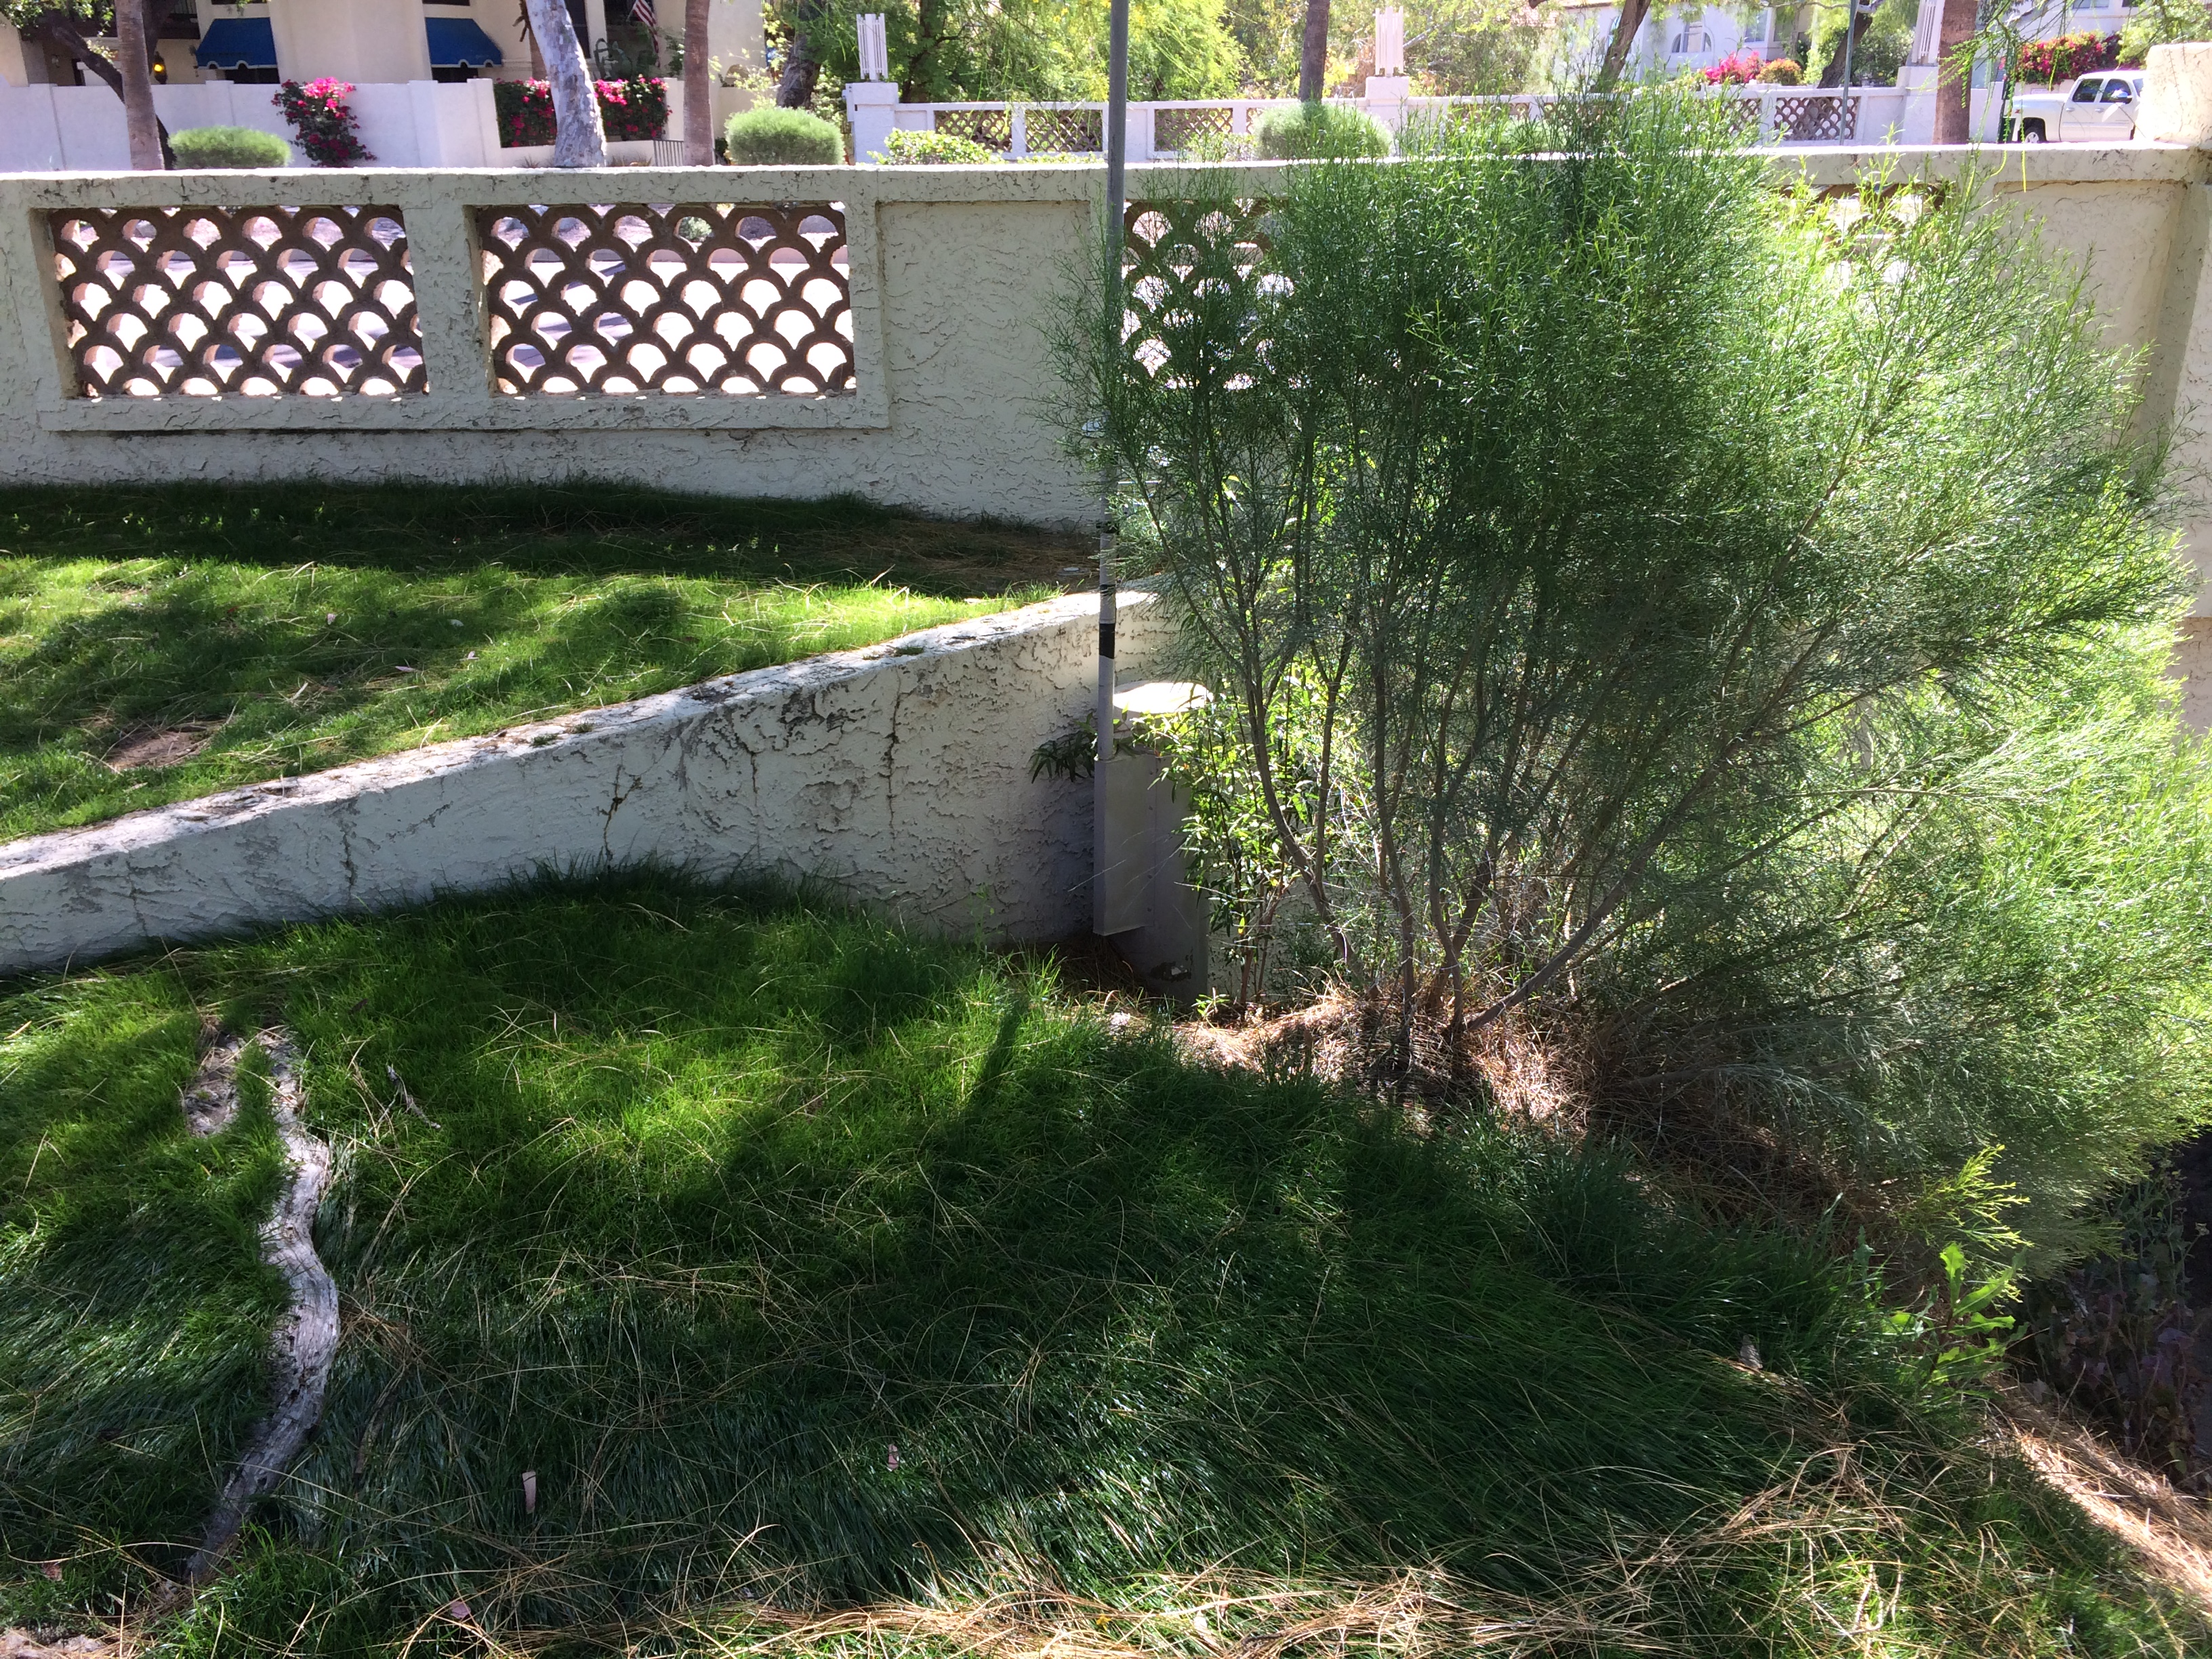
| LOCATION | Located near 48th Street and Guadalupe Road |
| DRAINAGE AREA | 1.51 mi2 |
| STREAM TYPE | Culvert |
| JURISDICTION | Phoenix, Arizona |
| WATERSHED | South Mountain |
| SECTION/TOWNSHIP/RANGE | S05 T1S R4E |
| LATITUDE | N 33° 21' 54.1" | +33.36504 |
| LONGITUDE | W 111° 58' 30.4" | -111.97512 |
| ARIZONA STATE PLANE | E 682150 | N 860330 |
| USGS QUAD SHEET | Guadalupe 7.5-Minute |
| STREAMGAGE INSTALLATION DATE | 04/15/2014 - WY 2014 |
| PERIOD OF AVAILABLE DATA RECORD | 04/15/2014 - Current |
| LENGTH OF AVAILABLE DATA RECORD (AS OF 10/01/2024) | 10.46 Years | 3,822 Days |
| GAPS (> 2 DAYS) IN RECORD | None |
| STAGE GAGE TYPE | Pressure Transducer |
| STAGE GAGE ELEVATION | 1.69 feet Gage Height |
| STAFF GAGES | 1 |
| CREST STAGE GAGES | None |
| ZERO GAGE HEIGHT ELEVATION | 1,302.896 feet NAVD88 |
| POINT OF ZERO FLOW | 1.8 feet Gage Height |
| EXTREME FOR PERIOD OF RECORD | 345 cfs | 6.52 feet Gage Height | 09/08/2014 |
| Current Rating = #2 - Applied since 10/01/2019 | ||
| Discharge (cfs) |
Elevation Feet, Gage Height |
Elevation Feet, NAVD88 |
| 0 | 1.69 | 1,304.59 |
| 123 | 2.50 | 1,305.40 |
| 246 | 3.78 | 1,306.68 |
| 369 | 4.84 | 1,307.74 |
| 492 | 5.80 | 1,308.70 |
| 615 | 6.71 | 1,309.61 |
| 861 | 8.45 | 1,311.35 |
| 1,200 | 10.92 | 1,313.82 |
| Water Year |
Peak Gage Height (feet) |
Peak Discharge (cfs) |
Date of Peak |
| 2025 | |||
| 2024 | None | 0 | None |
| 2023 | None | 0 | None |
| 2022 | None | 0 | None |
| 2021 | None | 0 | None |
| 2020 | None | 0 | None |
| 2019 | 3.29 | 45 | 10/02/2018 |
| 2018 | 2.87 | 29 | 08/10/2018 |
| 2017 | None | 0 | None |
| 2016 | None | 0 | None |
| 2015 | None | 0 | None |
| 2014 (partial) | 6.52 | 345 | 09/08/2014 |
| Date of Peak |
Time of Peak |
Runoff Start |
Runoff End |
Duration (hours) |
Peak Stage (feet GH) |
Peak Discharge (CFS) |
Water Year |
| View a Plot of These Data | |||||||
| 09/23/2019 | 05:28 | 09/23/2019 05:24 | 09/23/2019 05:42 | 0.3 | 2.78 | 26 | 2019 |
| 10/13/2018 | 14:45 | 10/13/2018 13:50 | 10/13/2018 15:23 | 1.6 | 3.22 | 41 | 2019 |
| 10/13/2018 | 11:24 | 10/13/2018 11:14 | 10/13/2018 11:32 | 0.3 | 2.55 | 13 | 2019 |
| 10/02/2018 | 08:59 | 10/02/2018 08:10 | 10/02/2018 09:52 | 1.7 | 3.29 | 45 | 2019 |
| 08/10/2018 | 23:27 | 08/10/2018 23:26 | 08/10/2018 23:45 | 0.3 | 2.65 | 22 | 2018 |
| 08/10/2018 | 00:43 | 08/10/2018 00:35 | 08/10/2018 01:00 | 0.4 | 2.87 | 29 | 2018 |
| 09/27/2014 | 16:16 | 09/27/2014 15:41 | 09/27/2014 17:18 | 1.6 | 2.86 | 28 | 2014 |
| 09/27/2014 | 14:54 | 09/27/2014 14:49 | 09/27/2014 15:16 | 0.5 | 3.26 | 43 | 2014 |
| 09/08/2014 | 10:03 | 09/08/2014 09:42 | 09/08/2014 10:41 | 1.0 | 3.36 | 49 | 2014 |
| 09/08/2014 | 06:26 | 09/08/2014 05:42 | 09/08/2014 08:23 | 2.7 | 4.79 | 159 | 2014 |
| 09/08/2014 | 05:08 | 09/08/2014 05:01 | 09/08/2014 05:29 | 0.5 | 2.96 | 32 | 2014 |
| 09/08/2014 | 02:51 | 09/08/2014 02:31 | 09/08/2014 04:10 | 1.7 | 6.52 | 345 | 2014 |
| 08/12/2014 | 18:55 | 08/12/2014 18:46 | 08/12/2014 19:56 | 1.2 | 4.39 | 122 | 2014 |
| Flood Flow Frequency View a plot of Flood Frequncy Data ***NOTE: Flood Flow Frequency data are for information only and should not be considered valid for regulation*** Magnitude and Probability of Instantaneous Peak Flow | Discharge, in cfs, for indicated Recurrence Interval |
|||||||
| USGS StreamStats Flood Flow Frequency | |||||||
| 2-year | 5-year | 10-year | 25-year | 50-year | 100-year | 200-year | 500-year |
| Staff Gage | 0 - 6 | Located near transducer gage, and displays gage height elevations |
| Crest Gage Number | Pin Elevation (Feet, Gage Height) |
Additional Information |
| 1 | 1.63 | Located on left bank near transducer |