
Page Last Updated: 23 October 2024
|
|
Page Last Updated: 23 October 2024 |
| ID | Elevation of Instrument in Gage Height |
Elevation of Instrument in Datum |
Period |
| 68207 | 0.18 feet | 1251.56 feet NAVD88 | 11/06/2023 -- current |
| 68207 | 0.26 feet | 1,251.64 feet NAVD88 | 04/24/2020 -- 05/30/2023 |
| 6503 | 0.26 feet | 1,251.64 feet NAVD88 | 10/01/1997 -- 04/24/2020 |
| 6503 | 0.26 feet | 1,249.62 feet NGVD29 | 10/01/1997 -- 04/24/2020 |
| 6503 | 0.00 feet | 1,249.36 feet NGVD29 | 06/29/1989 -- 09/30/1997 |
| STATUS | Active |
| LOCATION | Located west of I-10 and south of Baseline Road |
| DRAINAGE AREA | 1.78 mi2 |
| STREAM TYPE | Dam of natural drainage |
| JURISDICTION | Phoenix, Arizona |
| WATERSHED | South Mountain |
| SECTION/TOWNSHIP/RANGE | S05 T1S R4E |
| LATITUDE | N 33° 22' 21.1" | +33.37250 |
| LONGITUDE | W 111° 58' 07.3" | -111.96871 |
| ARIZONA STATE PLANE | E 683575 | N 862864 |
| USGS QUAD SHEET | Guadalupe 7.5-Minute |
| STREAMGAGE INSTALLATION DATE | 06/29/1989 - WY 1989 |
| PERIOD OF AVAILABLE DATA RECORD | 06/29/1989 - Current |
| LENGTH OF AVAILABLE DATA RECORD (AS OF 10/01/2024) | 35.26 Years | 12,878 Days |
| GAPS (> 2 DAYS) IN RECORD | 05/30/2023 - 10/31/2023 |
| STAGE GAGE TYPE | Pressure Transducer |
| STAGE GAGE ELEVATION | 0.26 feet Gage Height |
| STAFF GAGES | 6 |
| CREST STAGE GAGES | 0 |
| ZERO GAGE HEIGHT ELEVATION | 1,251.38 feet NAVD88 |
| POINT OF ZERO FLOW (GATED INLET) | 0.64 feet Gage Height |
| POINT OF ZERO FLOW (UNGATED INLET, CURRENTLY BLOCKED) | 5.60 feet Gage Height |
| SPILLWAY ELEVATION | 24.64 feet Gage Height |
| TOP OF DAM ELEVATION | 32.14 feet Gage Height |
| Current Discharge Rating = #4 - Applied since 09/20/2023 Current Capacity Rating = #4 - Applied since 10/01/2016 |
||||||
| Gage Height (feet) |
Elevation (feet NAVD 88) |
Volume (acre-feet) |
Discharge (cfs) gated inlet |
Discharge (cfs) spillway |
||
| 0.00 | 1,251.38 | 0.0 | 0 | 0 | ||
| 1.64 | 1,253.02 | 2.0 | 9 | 0 | ||
| 2.64 | 1,254.02 | 4.0 | 10 | 0 | ||
| 4.64 | 1,256.02 | 11.0 | 12 | 0 | ||
| 8.64 | 1,260.02 | 36.0 | 14 | 0 | ||
| 13.64 | 1,265.02 | 85.7 | 17 | 0 | ||
| 18.64 | 1,270.02 | 155.8 | 20 | 0 | ||
| 23.64 | 1,275.02 | 256.3 | 22 | 0 | ||
| 24.64 | 1,276.02 | 282.1 | 23 | 75 | ||
| 26.64 | 1,278.02 | 338.7 | 23 | 951 | ||
| 28.64 | 1,280.02 | 400.7 | 24 | 4,015 | ||
| 30.64 | 1,282.02 | 467.7 | 24 | 8,933 | ||
| 32.14 | 1,283.52 | 522.8 | 25 | 13,688 | ||
| Water Year |
Peak Gage Height (feet) |
Peak Volume (acre-feet) |
Percent Full (Available Storage Capacity) |
Date of Peak |
| 2025 | ||||
| 2024 | None | 0.0 | 0.0 | None |
| 2023 | None | 0.0 | 0.0 | None |
| 2022 | None | 0.0 | 0.0 | None |
| 2021 | None | 0.0 | 0.0 | None |
| 2020 | None | 0.0 | 0.0 | None |
| 2019 | 10.37 | 51.5 | 18.3 | 10/13/2018 |
| 2018 | None | 0.0 | 0.0 | None |
| 2017 | None | 0.0 | 0.0 | None |
| 2016 | None | 0.0 | 0.0 | None |
| 2015 | None | 0.0 | 0.0 | None |
| 2014 | 14.86 | 96 | 34.4 | 09/08/2014 |
| 2013 | 1.46 | 4.0 | 1.7 | 07/21/2013 |
| 2012 | None | 0.0 | 0.0 | None |
| 2011 | None | 0.0 | 0.0 | None |
| 2010 | None | 0.0 | 0.0 | None |
| 2009 | None | 0.0 | 0.0 | None |
| 2008 | 9.41 | 36 | 12.8 | 07/13/2008 |
| 2007 | None | 0.0 | 0.0 | None |
| 2006 | None | 0.0 | 0.0 | None |
| 2005 | 1.66 | 5 | 1.8 | 08/03/2005 |
| 2004 | None | 0.0 | 0.0 | None |
| 2003 | 3.68 | 13 | 4.6 | 09/04/2003 |
| 2002 | None | 0.0 | 0.0 | None |
| 2001 | 4.07 | 10 | 3.6 | 10/21/2000 |
| 2000 | None | 0.0 | 0.0 | None |
| 1999 | 4.02 | 10 | 3.6 | 07/15/1999 |
| 1998 | 3.91 | 9 | 3.2 | 08/17/1998 |
| 1997 | None | 0.0 | 0.0 | None |
| 1996 | None | 0.0 | 0.0 | None |
| 1995 | 4.26 | 12 | 4.3 | 09/28/1995 |
| 1994 | 3.45 | 8 | 2.8 | 11/15/1994 |
| 1993 | 4.80 | 15 | 5.3 | 01/11/1993 |
| 1992 | 1.90 | 3 | 1.1 | 11/11/1991 |
| 1991 | 2.30 | 4 | 1.4 | 05/24/1991 |
| 1990 | 5.50 | 18 | 6.4 | 08/15/1990 |
| 1989 (partial) | 0.80 | <1 | 0.0 | 09/03/1989 |
| Date of Peak |
Time of Peak |
Runoff Start |
Runoff End |
Duration (hours) |
Peak Stage (feet GH) |
Peak Volume (acre-feet) |
Water Year |
| View a Plot of These Data | |||||||
| 10/13/2018 | 15:45 | 10/13/2018 13:46 | 10/17/2018 18:00 | 100 | 10.37 | 51.5 | 2019 |
| 10/02/2018 | 12:00 | 10/02/2018 09:16 | 10/04/2018 15:36 | 54.3 | 8.37 | 34.2 | 2019 |
| 09/27/2014 | 17:45 | 09/27/2014 16:00 | 09/29/2014 12:40 | 44.7 | 6.06 | 23 | 2014 |
| 09/08/2014 | 10:32 | 09/08/2014 02:25 | 09/12/2014 06:39 | 100 | 14.86 | 96 | 2014 |
| 08/12/2014 | 20:01 | 08/12/2014 19:51 | 08/13/2014 12:35 | 16.7 | 5.71 | 22 | 2014 |
| 07/21/2013 | 09:59 | 07/21/2013 09:56 | 07/21/2013 16:40 | 6.7 | 1.46 | 4.0 | 2013 |
| 08/28/2008 | 21:47 | 08/28/2008 21:47 | single report | 0.0 | 0.51 | 1 | 2008 |
| 07/13/2008 | 17:38 | 07/13/2008 16:10 | 07/15/2008 20:55 | 52.8 | 9.41 | 36 | 2008 |
| 08/03/2005 | 02:42 | 08/03/2005 01:47 | 08/03/2005 04:47 | 3.0 | 1.66 | 5 | 2005 |
| 09/04/2003 | 18:41 | 09/04/2003 18:21 | 09/04/2003 19:11 | 0.8 | 3.68 | 13 | 2003 |
| 07/30/2003 | 09:08 | 07/30/2003 08:28 | 07/30/2003 16:33 | 8.1 | 2.31 | 8 | 2003 |
| 10/21/2000 | 21:42 | 10/21/2000 20:07 | 10/22/2000 19:31 | 23.4 | 4.07 | 10 | 2001 |
| 07/15/1999 | 09:43 | 07/15/1999 06:53 | 07/16/1999 07:23 | 24.5 | 4.02 | 10 | 1999 |
| 08/17/1998 | 21:26 | 08/17/1998 20:11 | 08/18/1998 17:56 | 21.8 | 3.91 | 9 | 1998 |
| 08/12/1998 | 18:56 | 08/12/1998 18:56 | 08/12/1998 19:41 | 0.8 | 1.99 | 3 | 1998 |
| 09/28/1995 | 04:47 | 09/28/1995 03:47 | 09/29/1995 23:30 | 43.7 | 4.26 | 12 | 1995 |
| 08/21/1995 | 03:12 | 08/20/1995 21:37 | 08/22/1995 03:15 | 29.6 | 3.76 | 9 | 1995 |
| 11/15/1993 | 08:16 | 11/14/1993 18:00 | 11/16/1993 07:00 | 37.0 | 3.45 | 8 | 1994 |
| 01/11/1993 | 05:53 | 01/11/1993 00:40 | 01/13/1993 19:11 | 66.5 | 4.80 | 15 | 1993 |
| 12/22/1992 | 18:11 | 12/22/1992 18:11 | single report | 0.0 | 2.30 | 5 | 1993 |
| 12/04/1992 | 16:47 | 12/04/1992 16:32 | 12/05/1992 11:43 | 19.2 | 3.80 | 10 | 1993 |
| 11/11/1991 | 07:57 | 11/10/1991 18:10 | 11/20/1991 14:06 | 236 | 1.90 | 3 | 1992 |
| 05/24/1991 | 06:04 | 05/23/1991 12:42 | 06/22/1991 12:35 | 720 | 2.30 | 4 | 1991 |
| 09/15/1990 | 19:15 | 09/14/1990 21:46 | 09/17/1990 15:47 | 66.0 | 4.30 | 12 | 1990 |
| 08/15/1990 | 07:19 | 08/15/1990 05:11 | 08/26/1990 13:21 | 272 | 5.50 | 18 | 1990 |
| 07/24/1990 | 06:05 | 07/24/1990 04:53 | 08/02/1990 12:26 | 223 | 1.90 | 3 | 1990 |
| 07/15/1990 | 07:30 | 07/15/1990 03:41 | 07/21/1990 14:26 | 155 | 1.80 | 3 | 1990 |
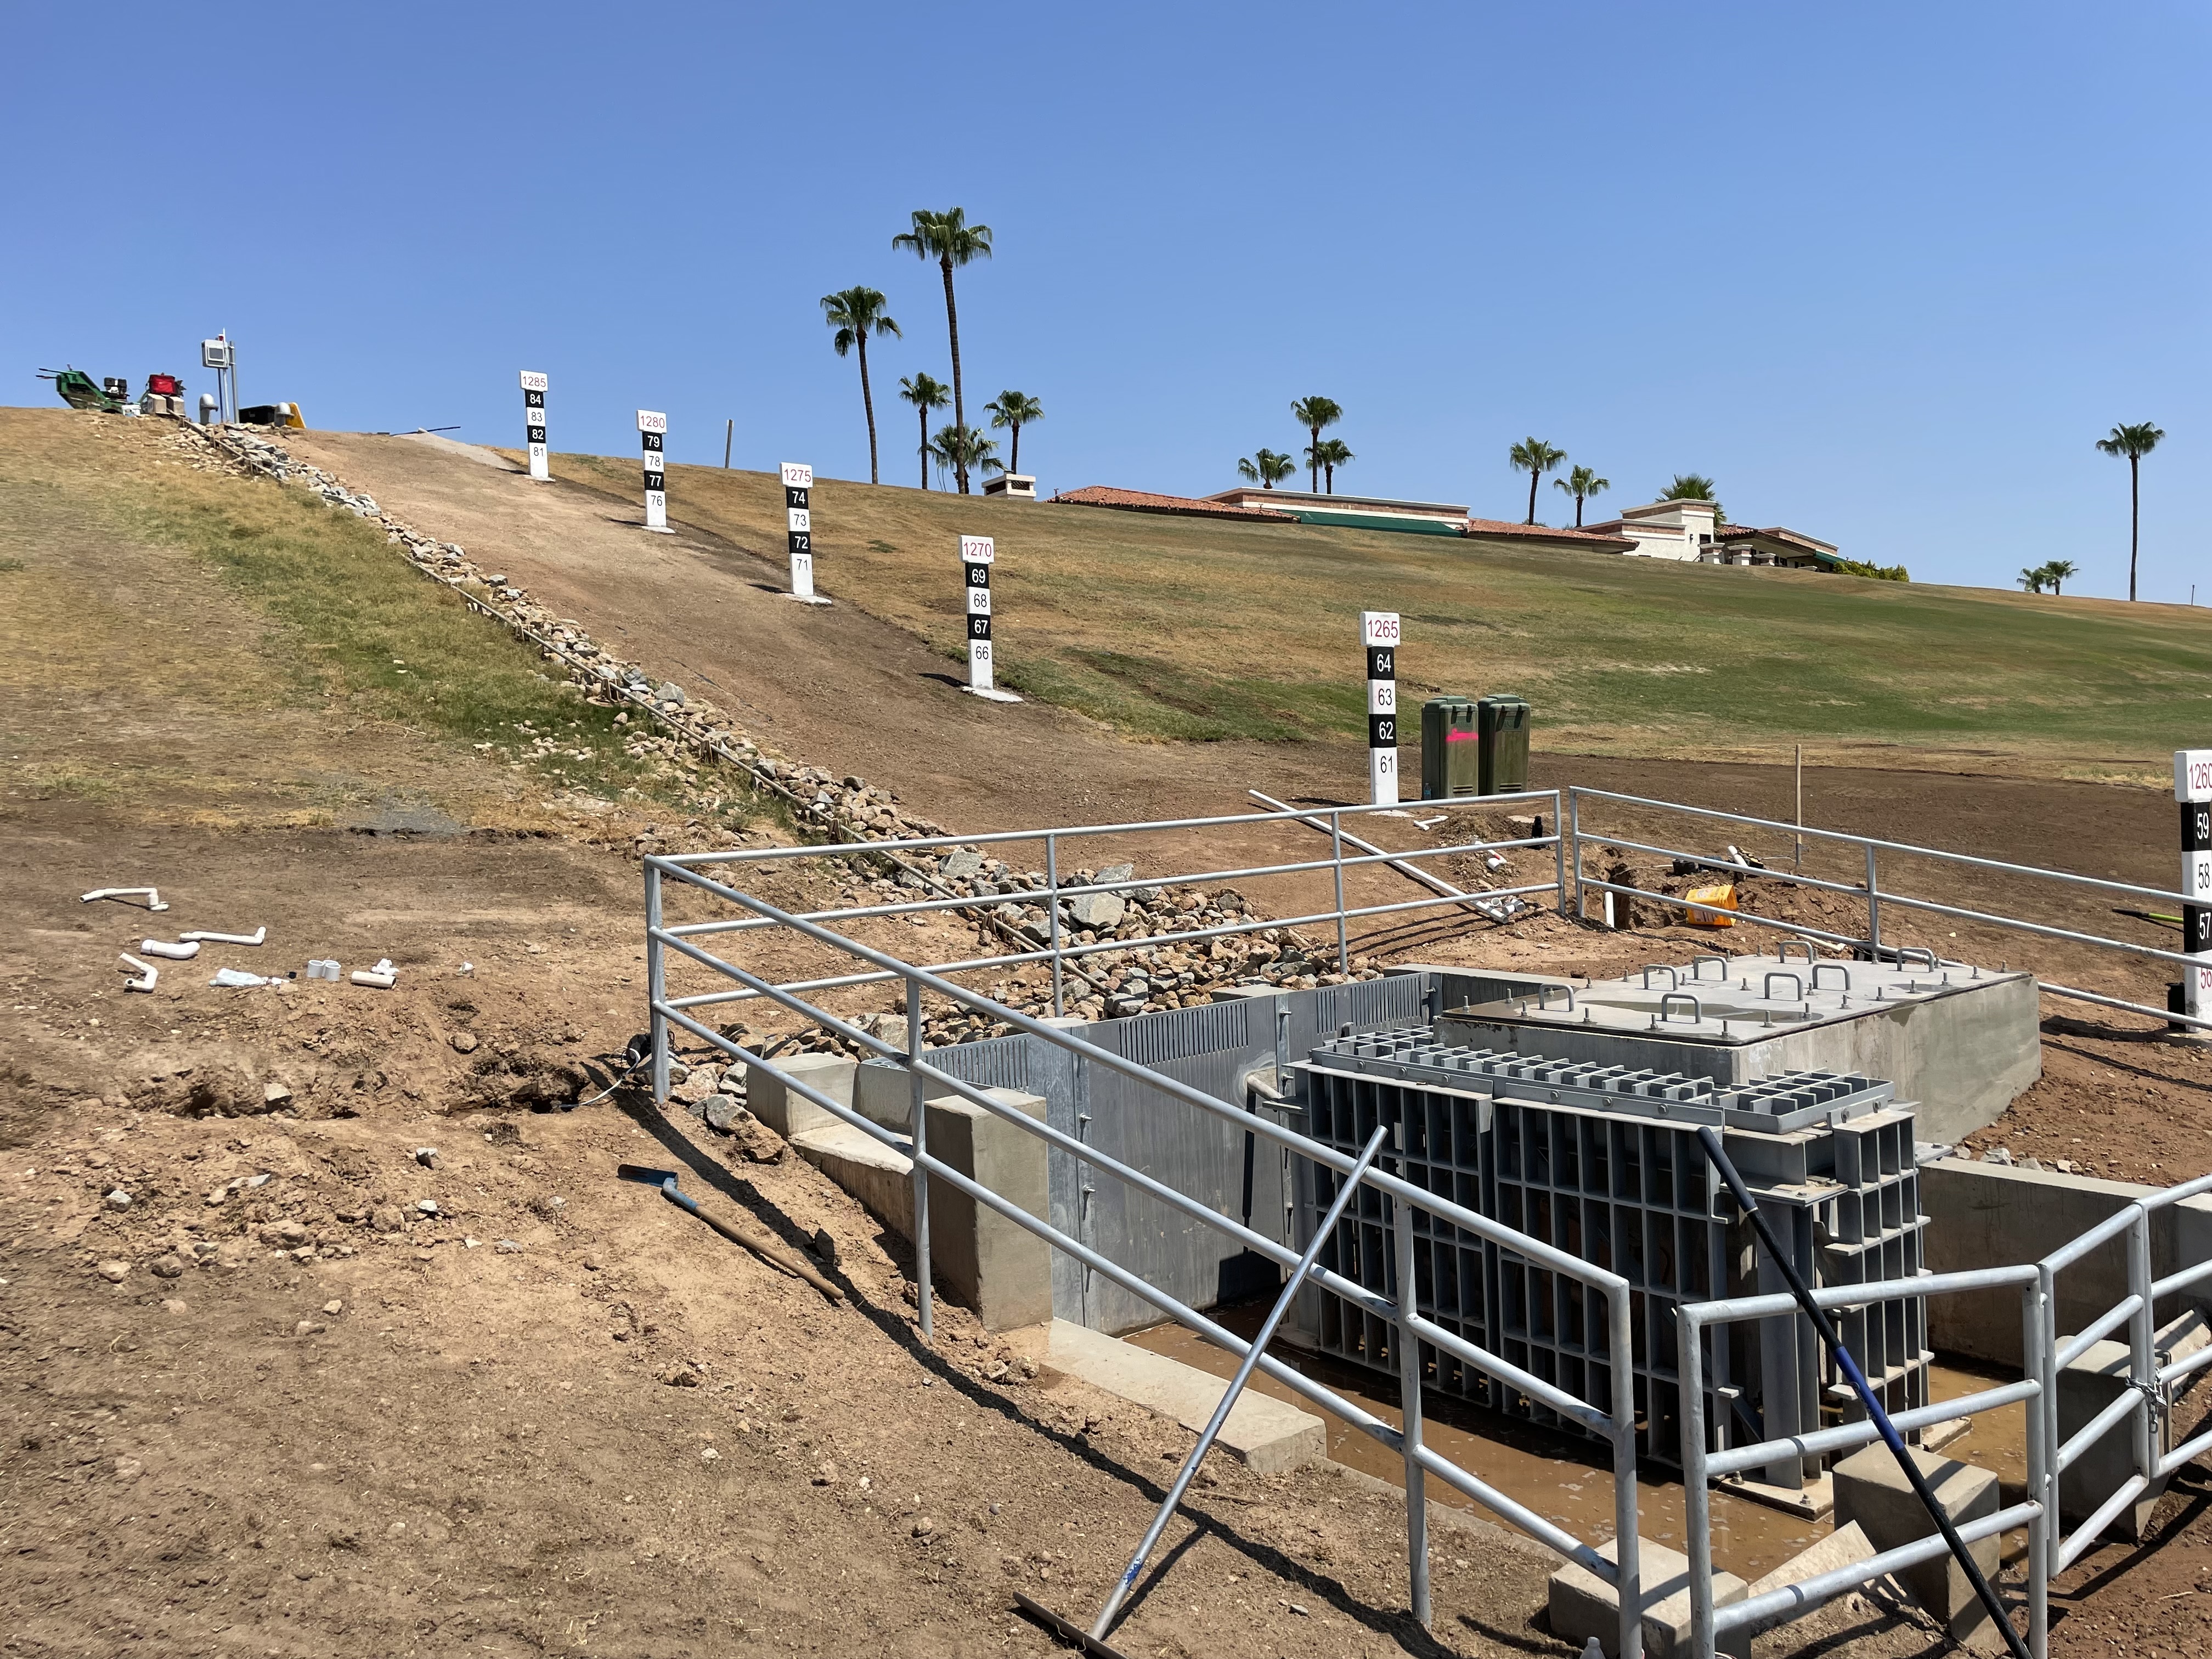
| Staff Gage Range (feet, NAVD88) | Staff Gage Information |
| 1,256.0 --- 1,260.0 | Gage displays as follows: bottom of 1,257.0 is 1,257.0 and top of 1,257.0 is 1,258.0 Subtract 1,251,38 to get gage height. |
| 1,261.0 --- 1,265.0 | Gage displays as follows: bottom of 1,262.0 is 1,262.0 and top of 1,262.0 is 1,263.0 Subtract 1,251,38 to get gage height. |
| 1,266.0 --- 1,270.0 | Gage displays as follows: bottom of 1,267.0 is 1,267.0 and top of 1,267.0 is 1,268.0 Subtract 1,251,38 to get gage height. |
| 1,271.0 --- 1,275.0 | Gage displays as follows: bottom of 1,272.0 is 1,272.0 and top of 1,272.0 is 1,273.0 Subtract 1,251,38 to get gage height. |
| 1,276.0 --- 1,280.0 | Gage displays as follows: bottom of 1,277.0 is 1,277.0 and top of 1,277.0 is 1,278.0 Subtract 1,251,38 to get gage height. |
| 1,281.0 --- 1,285.0 | Gage displays as follows: bottom of 1,282.0 is 1,282.0 and top of 1,282.0 is 1,283.0 Subtract 1,251,38 to get gage height. |