
Page Last Updated: 04 November 2025
|
|
Page Last Updated: 04 November 2025 |
| ID | Elevation of Instrument in Gage Height |
Elevation of Instrument in Datum |
Period |
| 65707 | 1.49 feet | 1,674.35 feet NAVD88 | 08/19/2015 -- Current |
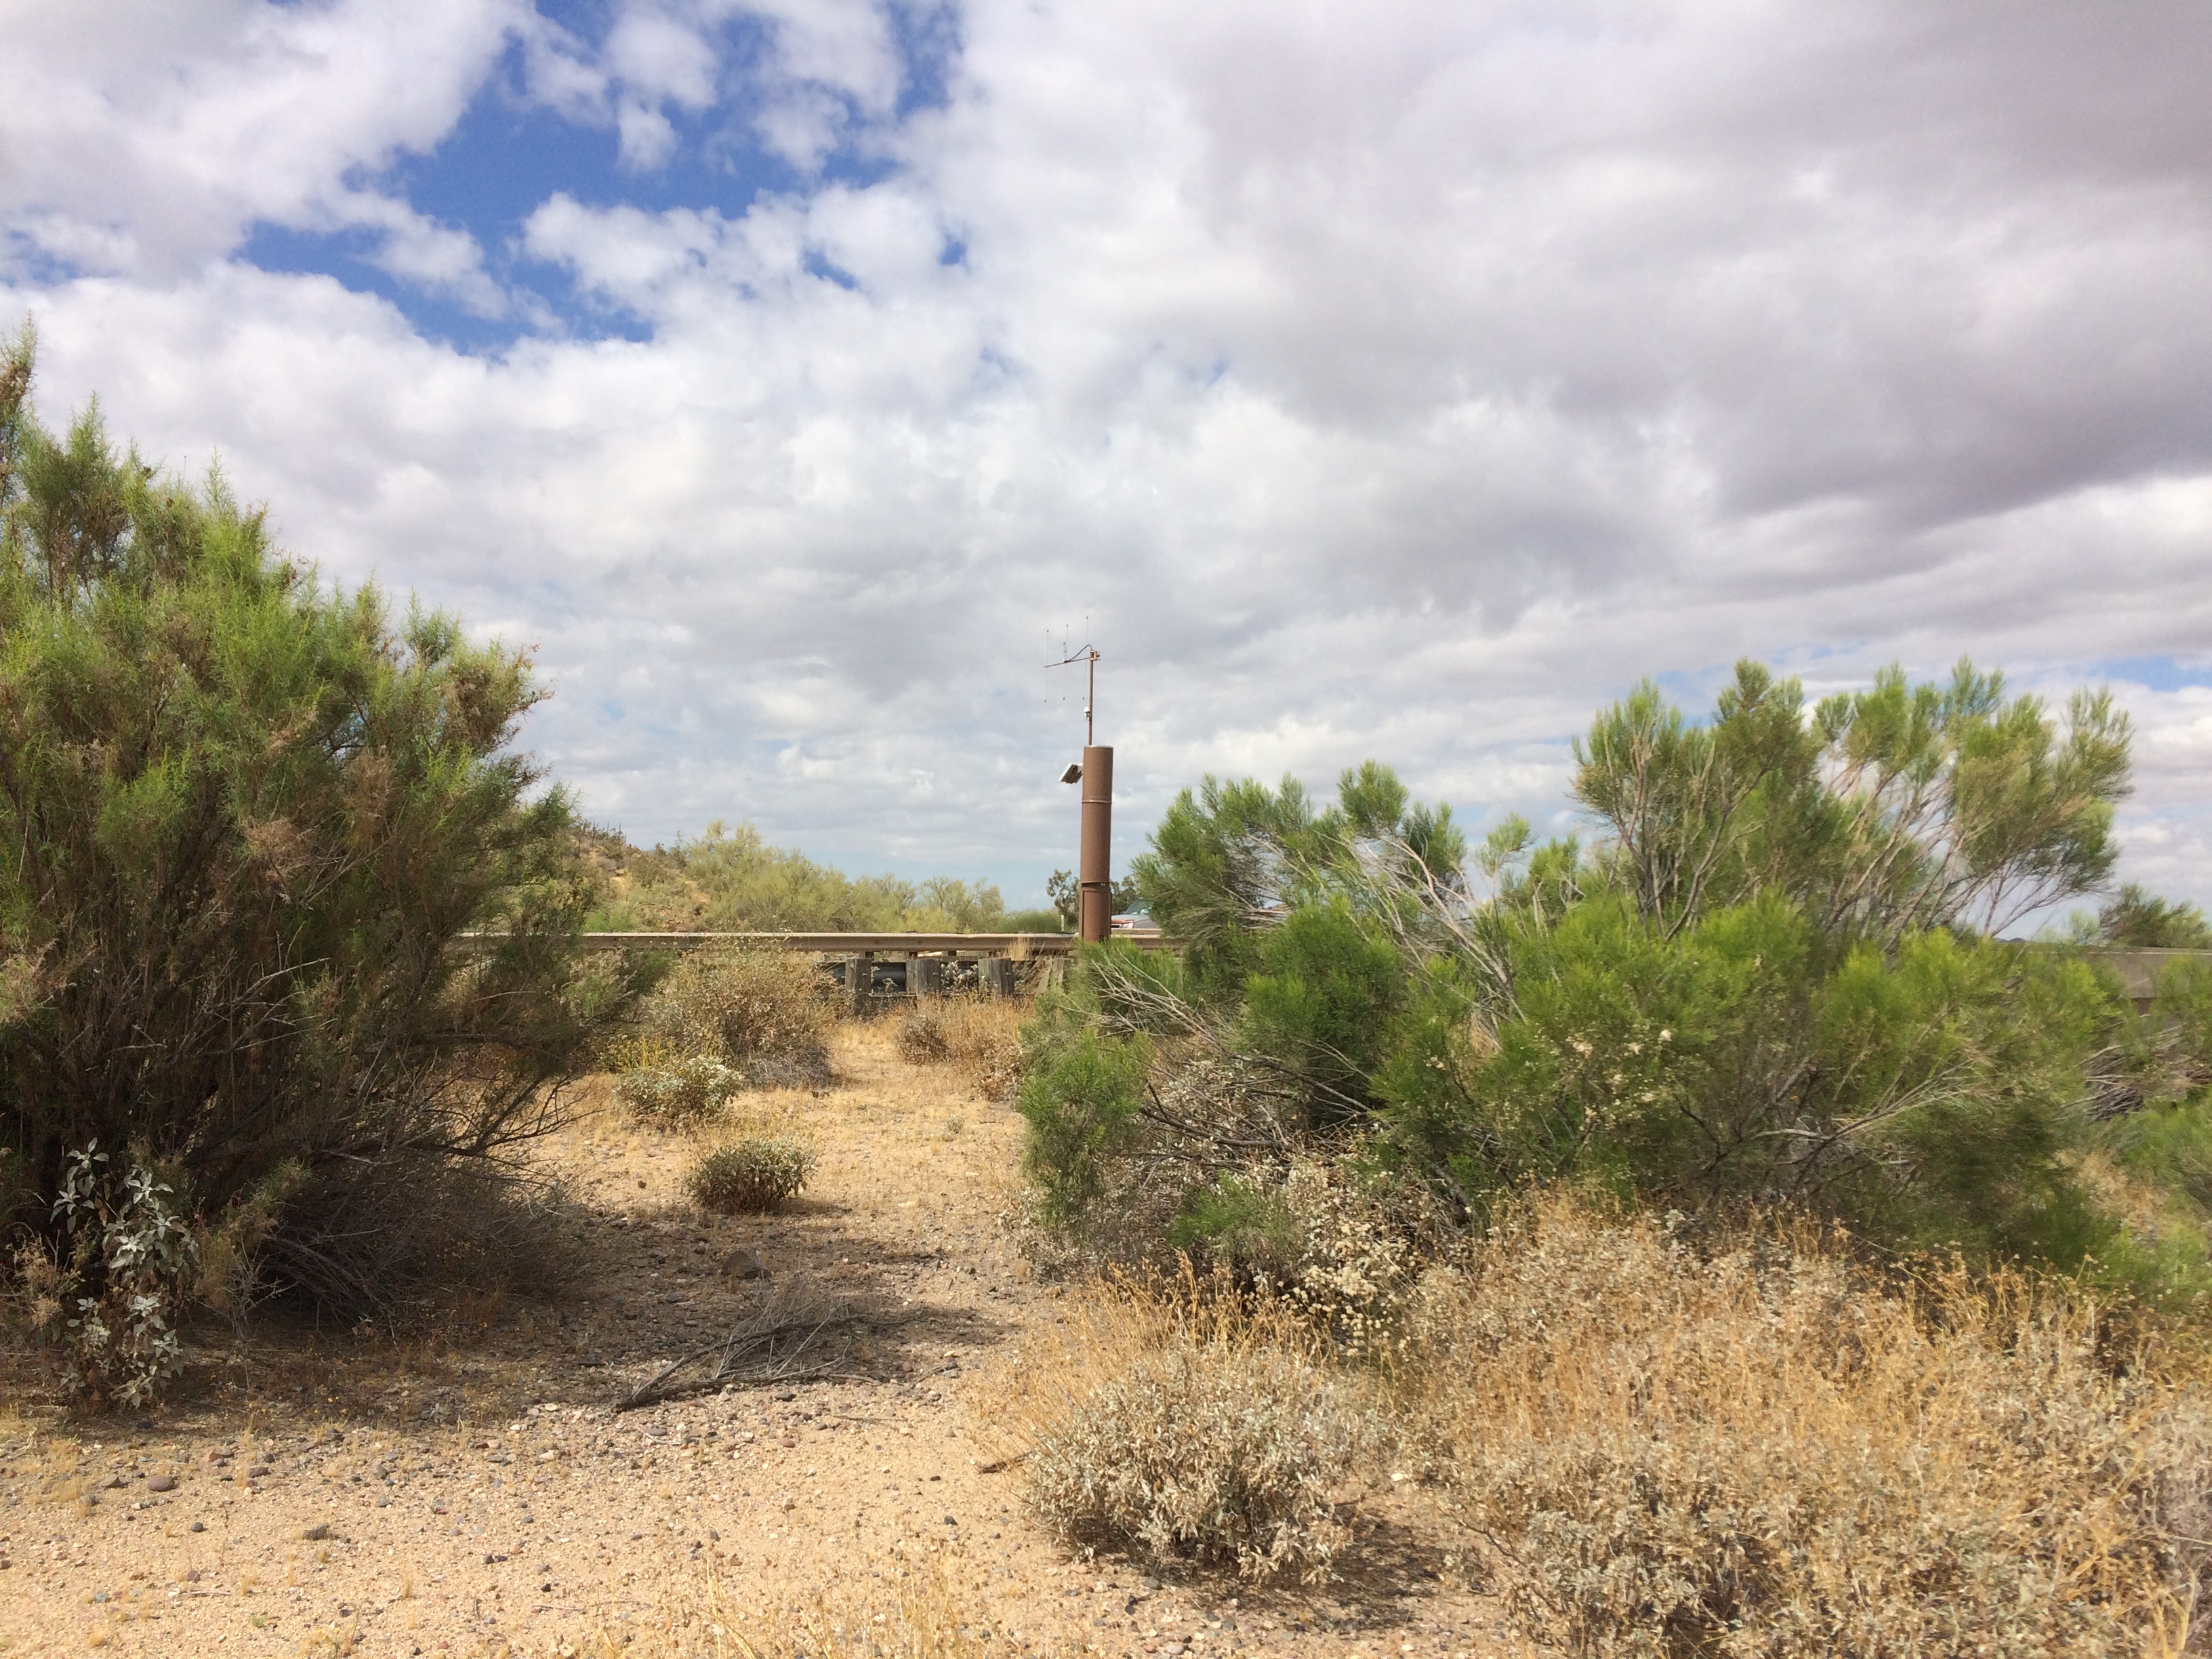
| STATUS | Active ALERT2 Sensor |
| LOCATION | Located on the westbound Carefree Highway bridge about 1/4 mile east of I-17 |
| DRAINAGE AREA | 48.8 mi2 |
| STREAM TYPE | Natural Stream |
| JURISDICTION | Phoenix, Arizona |
| WATERSHED | Skunk Creek |
| SECTION/TOWNSHIP/RANGE | S02 T5N R2E |
| LATITUDE | N 33° 47' 54.8" | +33.79849 |
| LONGITUDE | W 112° 07' 23.2" | -112.12310 |
| ARIZONA STATE PLANE | E 637291 | N 1018124 |
| USGS QUAD SHEET | New River SE 7.5-Minute |
| STREAMGAGE INSTALLATION DATE | 08/19/2015 - WY 2015 |
| PERIOD OF AVAILABLE DATA RECORD | 08/19/2015 - Current |
| LENGTH OF AVAILABLE DATA RECORD (AS OF 10/01/2024) | 9.12 Years | 3,331 Days |
| GAPS (> 2 DAYS) IN RECORD | None |
| STAGE GAGE TYPE | Pressure Transducer |
| STAGE GAGE ELEVATION | 1.49 feet Gage Height |
| STAFF GAGES | None |
| CREST STAGE GAGES | 1 |
| ZERO GAGE HEIGHT ELEVATION | 1,672.858 feet NAVD88 |
| POINT OF ZERO FLOW | 0.2 feet Gage Height |
| EXTREME FOR PERIOD OF RECORD | ~11,000 cfs | ~8.5 feet | 07/23/2021 |
| Current Rating = #3 - Applied since 08/19/2015 | ||
| Discharge (cfs) |
Elevation feet Gage Height |
Elevation feet NAVD88 |
| 0 | 0.00 | 1,672.86 |
| 100 | 1.60 | 1,674.46 |
| 500 | 2.69 | 1,675.55 |
| 1,000 | 3.41 | 1,676.27 |
| 2,000 | 4.30 | 1,677.16 |
| 5,000 | 6.05 | 1,678.91 |
| 10,000 | 8.04 | 1,680.90 |
| Water Year |
Peak Gage Height (feet) |
Peak Discharge (cfs) |
Date of Peak |
Notes |
| 2026 | ||||
| 2025 | 3.04 | 703 | 09/27/2025 | |
| 2024 | 2.74 | 528 | 08/31/2024 | |
| 2023 | 3.71 | 1,290 | 08/31/2023 | |
| 2022 | 3.38 | 973 | 07/30/2022 | |
| 2021 | ~8.3 (estimated) | ~11,000* | 07/23/2021 | *PT detached during event so elevs. are estimated, and peak is consistent with up and downstream flows |
| 2020 | 4.50 | 3,193 | 11/20/2019 | |
| 2019 | 4.55 | 3,319 | 09/23/2019 | |
| 2018 | 2.98 | 750 | 07/14/2018 | |
| 2017 | 4.17 | 2,398 | 01/01/2017 | |
| 2016 | 3.50 | 1,300 | 10/20/2015 | |
| 2015 (partial) | None | 0 | None |
| Date of Peak |
Time of Peak |
Runoff Start |
Runoff End |
Duration (hours) |
Peak Stage (feet GH) |
Peak Discharge (CFS) |
Water Year |
| View a Plot of These Data | |||||||
| 09/27/2025 | 22:04 | 09/27/2025 20:00 | 09/28/2025 12:00 | 16.0 | 3.04 | 703 | 2025 |
| 06/02/2025 | 04:21 | 06/02/2025 04:00 | 06/03/2025 00:00 | 20.0 | 2.44 | 381 | 2025 |
| 08/31/2024 | 20:59 | 08/31/2024 20:00 | 09/01/2024 03:18 | 7.3 | 2.74 | 528 | 2024 |
| 03/22/2023 | 09:23 | 03/22/2023 07:12 | 03/23/2023 04:32 | 22.4 | 3.11 | 749 | 2023 |
| 03/11/2023 | 22:10 | 03/11/2023 18:00 | 03/12/2023 08:48 | 14.8 | 2.21 | 291 | 2023 |
| 03/02/2023 | 00:18 | 03/01/2023 18:00 | 03/02/2023 19:42 | 25.7 | 2.41 | 370 | 2023 |
| 01/17/2023 | 07:18 | 01/17/2023 06:00 | 01/17/2023 18:00 | 12.0 | 2.01 | 214 | 2023 |
| 01/01/2023 | 18:57 | 01/01/2023 18:00 | 01/02/2023 10:07 | 16.1 | 2.86 | 605 | 2023 |
| 08/21/2022 | 00:00 | 08/21/2022 00:00 | 08/21/2022 14:58 | 15.0 | 2.78 | 555 | 2022 |
| 08/19/2022 | 22:33 | 08/19/2022 22:32 | 08/20/2022 20:44 | 22.2 | 2.38 | 358 | 2022 |
| 08/18/2022 | 23:38 | 08/18/2022 23:30 | 08/19/2022 06:48 | 7.3 | 2.21 | 291 | 2022 |
| 07/30/2022 | 21:52 | 07/30/2022 21:37 | 07/31/2022 12:00 | 14.4 | 3.38 | 972 | 2022 |
| 07/29/2022 | 07:30 | 07/29/2022 07:22 | 07/29/2022 14:17 | 6.9 | 2.41 | 372 | 2022 |
| 07/28/2022 | 15:21 | 07/28/2022 15:12 | 07/28/2022 23:03 | 7.9 | 2.56 | 436 | 2022 |
| 07/27/2022 | 12:50 | 07/27/2022 12:48 | 07/28/2022 00:00 | 11.2 | 2.18 | 279 | 2022 |
| 07/26/2022 | 00:43 | 07/26/2022 00:34 | 07/26/2022 08:40 | 8.1 | 2.68 | 495 | 2022 |
| 12/24/2021 | 18:00 | 12/24/2021 14:48 | 12/25/2021 04:14 | 13.4 | 2.78 | 555 | 2022 |
| 08/18/2021 | 15:59 | 08/18/2021 15:54 | 08/19/2021 12:00 | 20.1 | 2.98 | 671 | 2021 |
| 08/17/2021 | 02:12 | 08/17/2021 00:46 | 08/17/2021 15:04 | 14.3 | 2.48 | 400 | 2021 |
| 08/14/2021 | 00:50 | 08/13/2021 23:00 | 08/14/2021 15:48 | 16.8 | 3.18 | 794 | 2021 |
| 08/12/2021 | 09:09 | 08/12/2021 08:04 | 08/13/2021 00:00 | 15.9 | 3.60 | 1,180 | 2021 |
| 07/31/2021 | 05:14 | 07/31/2021 05:02 | 07/31/2021 13:10 | 8.1 | 1.91 | 180 | 2021 |
| 07/25/2021 | 15:05 | 07/24/2021 23:08 | 07/26/2021 13:25 | 38.3 | 3.38 | 972 | 2021 |
| 07/23/2021 | 14:26 | 07/23/2021 06:05 | 07/24/2021 09:40 | 27.6 | 8.30 (est.) | 11,000 | 2021 |
| 03/13/2020 | 15:01 | 03/12/2020 17:50 | 03/14/2020 12:00 | 42.2 | 2.93 | 643 | 2020 |
| 03/13/2020 | 04:24 | 03/12/2020 17:50 | 03/14/2020 12:00 | 42.2 | 3.18 | 794 | 2020 |
| 03/12/2020 | 19:16 | 03/12/2020 17:50 | 03/14/2020 12:00 | 42.2 | 3.01 | 688 | 2020 |
| 11/29/2019 | 07:06 | 11/29/2019 04:20 | 11/30/2019 05:53 | 25.6 | 4.18 | 1,849 | 2020 |
| 11/21/2019 | 19:39 | 11/20/2019 14:16 | 11/22/2019 12:00 | 45.7 | 3.28 | 881 | 2020 |
| 11/20/2019 | 20:17 | 11/20/2019 14:16 | 11/22/2019 12:00 | 45.7 | 4.50 | 2,262 | 2020 |
| 11/20/2019 | 16:39 | 11/20/2019 14:16 | 11/22/2019 12:00 | 45.7 | 3.80 | 1,379 | 2020 |
| 09/26/2019 | 21:03 | 09/26/2019 21:01 | 09/27/2019 10:31 | 13.5 | 4.13 | 1,787 | 2019 |
| 09/23/2019 | 14:29 | 09/23/2019 12:23 | 09/24/2019 07:03 | 18.7 | 4.55 | 2,330 | 2019 |
| 02/21/2019 | 17:21 | 02/21/2019 16:54 | 02/22/2019 20:20 | 27.4 | 2.46 | 391 | 2019 |
| 02/06/2019 | 06:00 | 02/06/2019 05:30 | 02/06/2019 10:51 | 5.4 | 2.39 | 362 | 2019 |
| 10/13/2018 | 17:25 | 10/13/2018 16:24 | 10/14/2018 03:43 | 11.3 | 2.54 | 427 | 2019 |
| 10/07/2018 | 10:12 | 10/07/2018 10:10 | 10/07/2018 20:36 | 10.4 | 2.51 | 413 | 2019 |
| 10/03/2018 | 13:23 | 10/03/2018 13:21 | 10/03/2018 23:39 | 10.3 | 2.54 | 427 | 2019 |
| 10/02/2018 | 12:23 | 10/02/2018 08:56 | 10/03/2018 07:26 | 22.5 | 3.83 | 1,412 | 2019 |
| 08/15/2018 | 03:16 | 08/15/2018 03:10 | 08/15/2018 10:11 | 7.0 | 2.36 | 350 | 2018 |
| 07/30/2018 | 22:39 | 07/30/2018 22:32 | 07/31/2018 09:45 | 11.2 | 3.03 | 700 | 2018 |
| 07/30/2018 | 20:16 | 07/30/2018 20:14 | 07/30/2018 21:26 | 1.2 | 2.18 | 279 | 2018 |
| 07/14/2018 | 17:18 | 07/14/2018 17:14 | 07/15/2018 02:36 | 9.4 | 2.98 | 671 | 2018 |
| 08/03/2017 | 17:09 | 08/03/2017 17:01 | 08/03/2017 18:53 | 1.9 | 2.33 | 338 | 2017 |
| 07/31/2017 | 21:40 | 07/31/2017 21:36 | 08/01/2017 01:03 | 3.5 | 2.43 | 379 | 2017 |
| 02/28/2017 | 08:26 | 02/28/2017 03:47 | 03/01/2017 02:43 | 22.9 | 3.70 | 1,278 | 2017 |
| 01/21/2017 | 03:38 | 01/20/2017 22:53 | 01/21/2017 18:00 | 19.1 | 3.20 | 809 | 2017 |
| 01/01/2017 | 09:45 | 01/01/2017 07:52 | 01/02/2017 02:48 | 18.9 | 4.17 | 1,836 | 2017 |
| 12/24/2016 | 21:08 | 12/24/2016 18:29 | 12/25/2016 08:32 | 14.1 | 2.38 | 358 | 2017 |
| 12/22/2016 | 12:30 | 12/22/2016 08:13 | 12/23/2016 01:12 | 17.0 | 3.77 | 1,348 | 2017 |
| 08/05/2016 | 10:51 | 08/05/2016 07:52 | 08/05/2016 19:49 | 12.0 | 2.54 | 427 | 2016 |
| 08/03/2016 | 16:44 | 08/03/2016 16:39 | 08/04/2016 02:19 | 9.7 | 2.67 | 490 | 2016 |
| 08/02/2016 | 18:01 | 08/02/2016 16:39 | 08/03/2016 02:37 | 10.0 | 3.49 | 1,073 | 2016 |
| 01/07/2016 | 15:51 | 01/07/2016 07:47 | 01/08/2016 09:29 | 25.7 | 3.06 | 718 | 2016 |
| 01/06/2016 | 03:28 | 01/06/2016 02:55 | 01/07/2016 00:00 | 21.1 | 3.23 | 835 | 2016 |
| 10/20/2015 | Data Unavailable | Gage Failure | 3.50 (estimated) | 1,300 | 2016 | ||
| 10/06/2015 | 11:16 | 10/06/2015 09:41 | 10/06/2015 16:22 | 6.7 | 2.61 | 460 | 2016 |
| Flood Flow Frequency View a plot of Flood Frequncy Data ***NOTE: Flood Flow Frequency data are for information only and should not be considered valid for regulation*** Magnitude and Probability of Instantaneous Peak Flow | Discharge, in cfs, for indicated Recurrence Interval |
|||||||
| FEMA Flood Insurance Study | |||||||
| 2-year | 5-year | 10-year | 20-year | 50-year | 100-year | 200-year | 500-year |
| ----- | ----- | ----- | ----- | ----- | 27,300 | ----- | ----- |
| Staff Gage Range | Staff Gage Information |
| 0 - 11 | Painted gage, viewable from the southwest corner of the bridge. Subtract 3.13 feet from painted gage readings to convert to Gage Height. |
| Crest Gage Number | Pin Elevation (Feet, Gage Height) |
Additional Information |
| 1 | 3.02 | Located on the pier with the pressure transducer |