
Page Last Updated: 04 November 2025
|
|
Page Last Updated: 04 November 2025 |
| ID | Elevation of Instrument in Gage Height |
Elevation of Instrument in Datum |
Period |
| 64907 | 2.20 feet | 1,545.717 feet NAVD88 | 01/11/2016 -- Current |
| STATUS | Active ALERT2 Sensor |
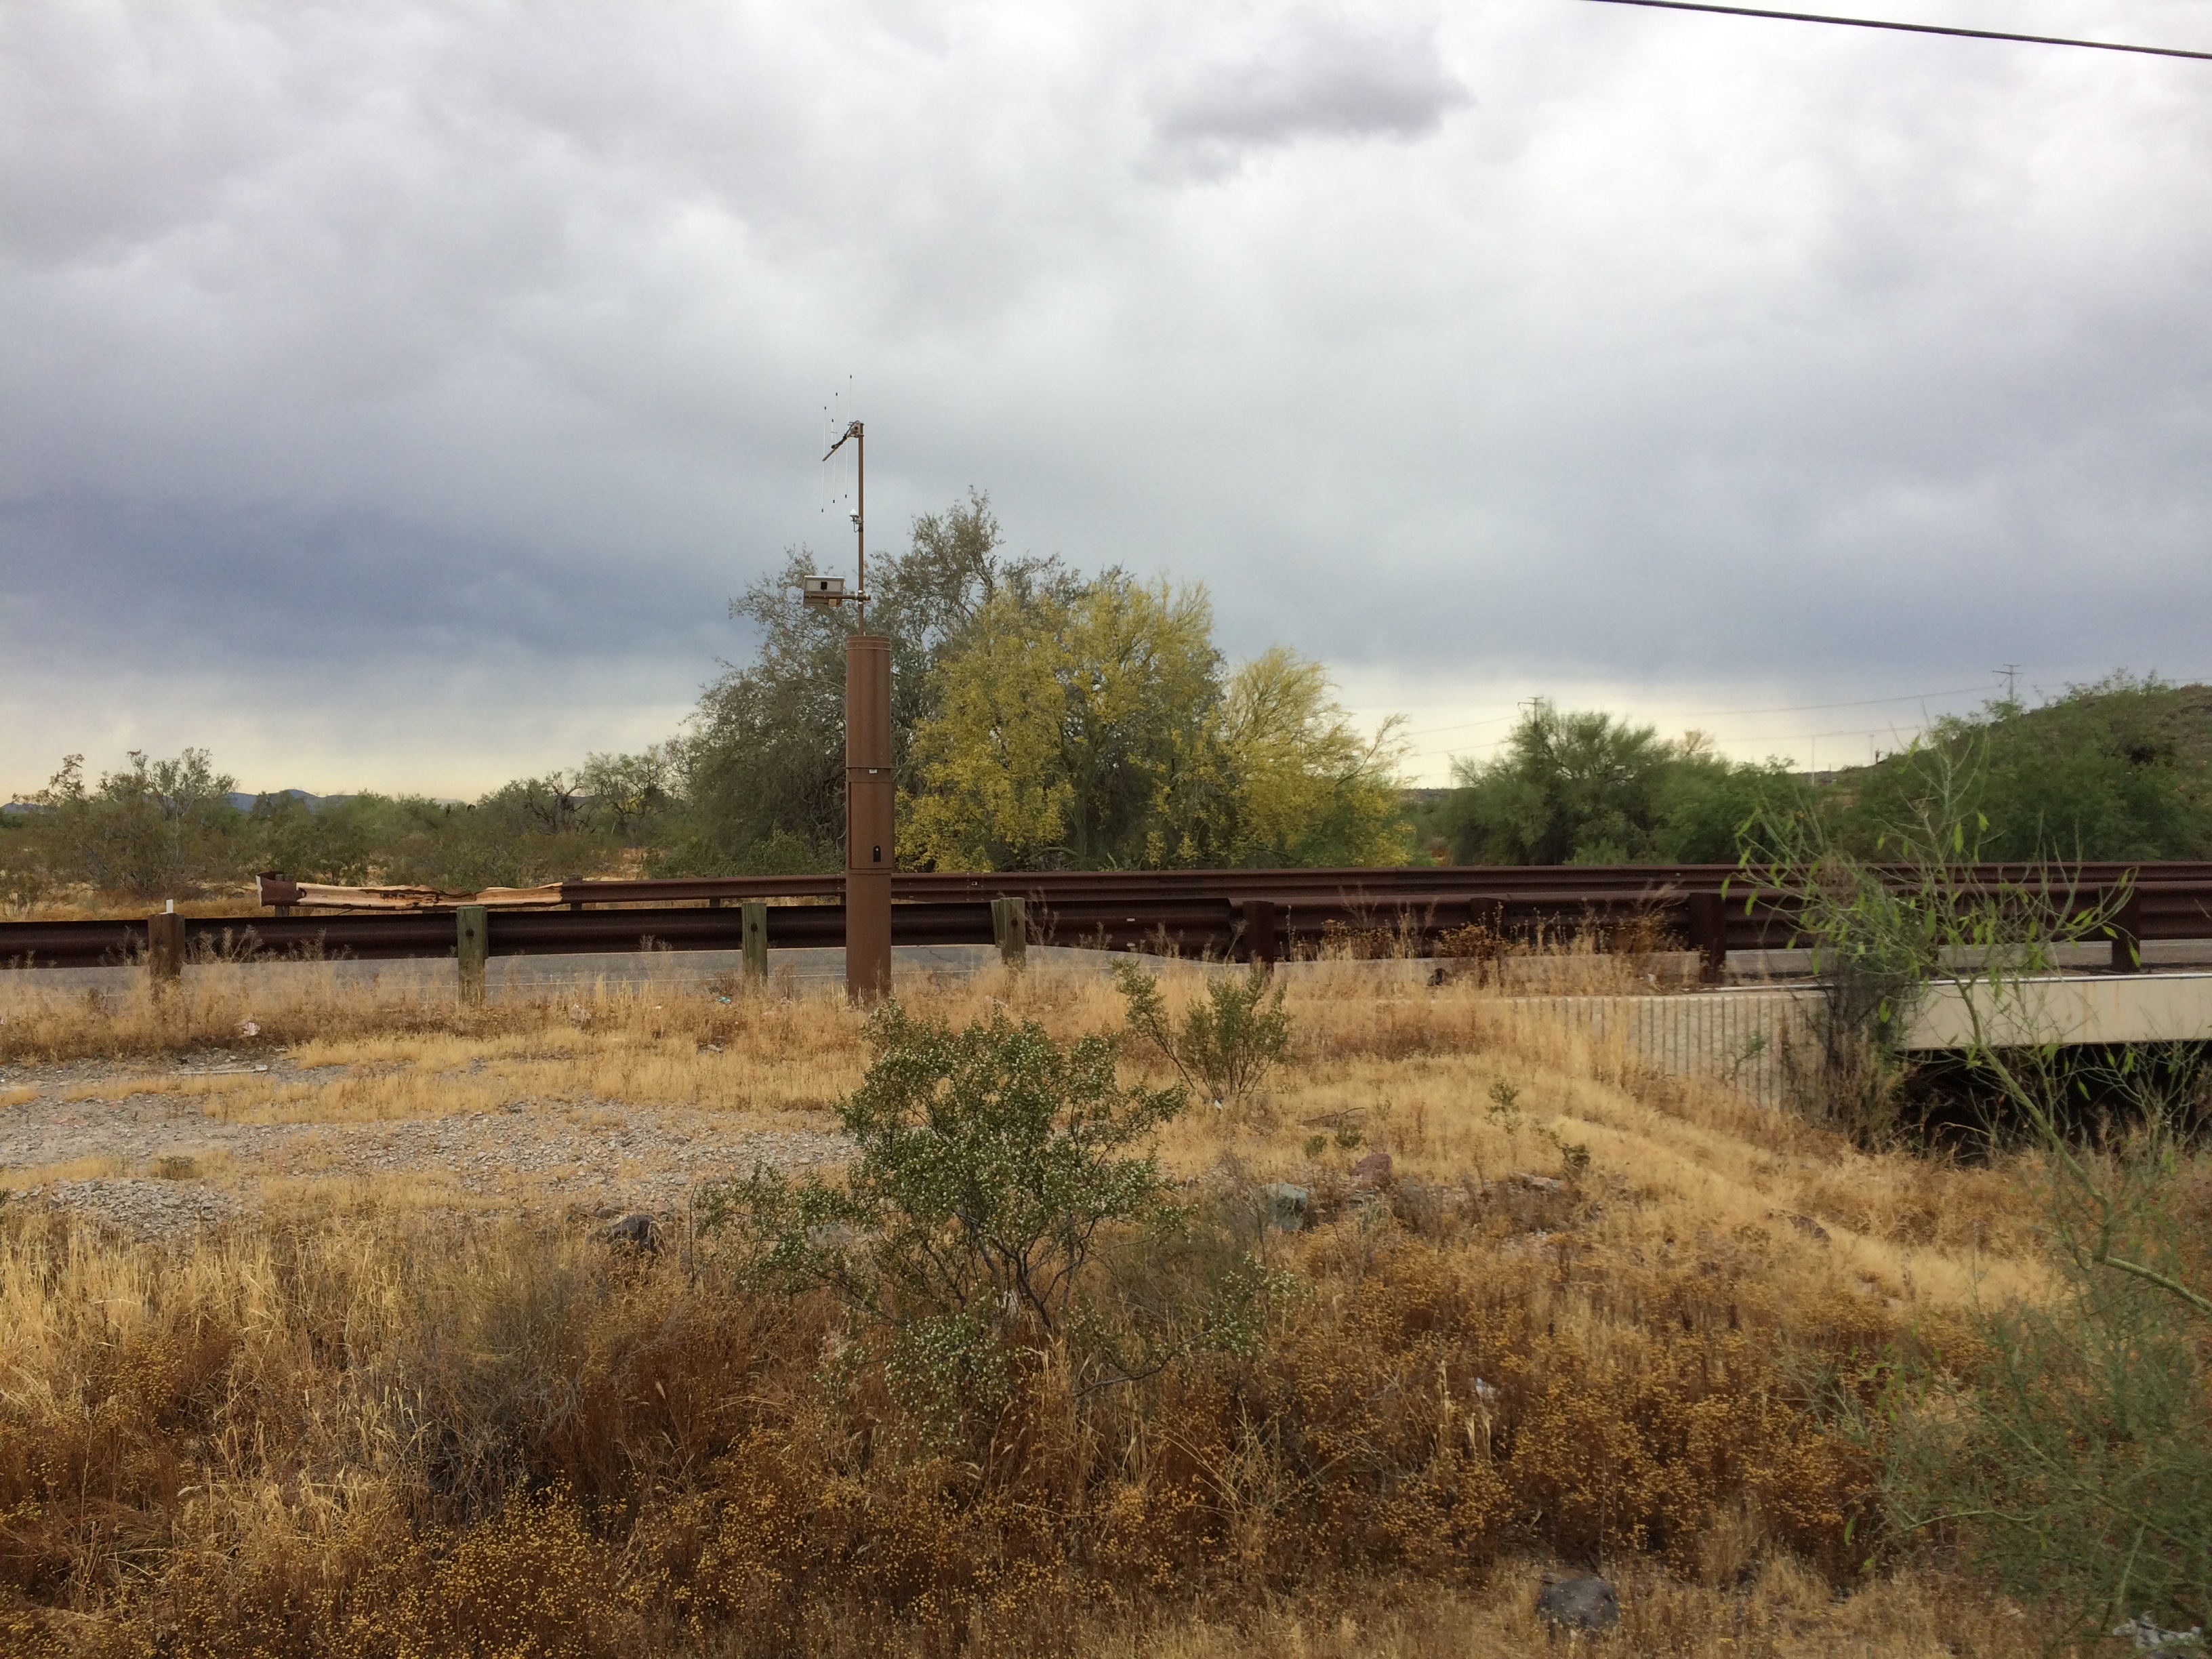
| LOCATION | Located on Dixileta Drive about 1/4 mile east of I-17 |
| DRAINAGE AREA | 50.1 mi2 |
| STREAM TYPE | Natural Stream |
| JURISDICTION | Phoenix, Arizona |
| WATERSHED | Skunk Creek |
| SECTION/TOWNSHIP/RANGE | S23 T5N R2E |
| LATITUDE | N 33° 45' 24.3" | +33.75676 |
| LONGITUDE | W 112° 07' 20.0" | -112.12222 |
| ARIZONA STATE PLANE | E 637525 | N 1002940 |
| USGS QUAD SHEET | New River SE 7.5-Minute |
| STREAMGAGE INSTALLATION DATE | 01/11/2016 - WY 2016 |
| PERIOD OF AVAILABLE DATA RECORD | 01/11/2016 - Current |
| LENGTH OF AVAILABLE DATA RECORD (AS OF 10/01/2024) | 8.72 Years | 3,186 Days |
| GAPS (> 2 DAYS) IN RECORD | None |
| STAGE GAGE TYPE | Pressure Transducer |
| STAGE GAGE ELEVATION | 2.20 feet Gage Height |
| STAFF GAGES | None |
| CREST STAGE GAGES | 1 |
| ZERO GAGE HEIGHT ELEVATION | 1,543.517 feet NAVD88 |
| POINT OF ZERO FLOW | 0.0 feet Gage Height |
| EXTREME FOR PERIOD OF RECORD | 11/20/2019 | 3,186 cfs | 3.94 feet GH |
| Current Rating = #2 - Applied since 01/11/2016 | ||
| Discharge (cfs) |
Elevation feet Gage Height |
Elevation feet NAVD88 |
| 0 | 0.00 | 1,543.52 |
| 100 | 1.26 | 1,544.78 |
| 613 | 2.20 | 1,545.72 |
| 800 | 2.43 | 1,545.95 |
| 1,000 | 2.63 | 1,546.15 |
| 2,000 | 3.20 | 1,546.72 |
| 5,000 | 4.28 | 1,547.80 |
| 10,000 | 5.95 | 1,549.47 |
| Water Year |
Peak Gage Height (feet) |
Peak Discharge (cfs) |
Date of Peak |
| 2026 | |||
| 2025 | None | 0 | None |
| 2024 | None | 0 | None |
| 2023 | 3.00 | 965 | 09/01/2023 |
| 2022 | None | 0 | None |
| 2021 | 3.94 | 3,186 | 07/23/2021 |
| 2020 | 3.94 | 1,394 | 11/20/2019 |
| 2019 | 4.84 | 1,947 | 09/23/2019 |
| 2018 | None | 0 | None |
| 2017 | 4.25 | 1,585 | 01/01/2017 |
| 2016 (partial) | None | 0 | None |
| Date of Peak |
Time of Peak |
Runoff Start |
Runoff End |
Duration (hours) |
Peak Stage (feet GH) |
Peak Discharge (CFS) |
Water Year |
| View a Plot of These Data | |||||||
| 09/01/2023 | 01:19 | 09/01/2023 00:00 | 09/01/2023 02:48 | 2.8 | 3.00 | 1,600 | 2023 |
| 07/25/2021 | 16:05 | 07/25/2021 15:59 | 07/25/2021 16:44 | 0.8 | 2.54 | 918 | 2021 |
| 11/29/2019 | 07:55 | 11/29/2019 07:35 | 11/29/2019 12:00 | 4.4 | 3.54 | 2,808 | 2020 |
| 11/20/2019 | 21:09 | 11/20/2019 17:25 | 11/21/2019 00:00 | 6.6 | 3.94 | 3,903 | 2020 |
| 11/20/2019 | 18:00 | 11/20/2019 17:25 | 11/21/2019 00:00 | 6.6 | 2.92 | 1,475 | 2020 |
| 09/26/2019 | 22:19 | 09/26/2019 22:17 | 09/26/2019 23:10 | 0.9 | 2.84 | 1,337 | 2019 |
| 09/23/2019 | 15:20 | 09/23/2019 15:09 | 09/23/2019 18:22 | 3.2 | 4.84 | 6,884 | 2019 |
| 02/28/2017 | 08:49 | 02/28/2017 08:31 | 02/28/2017 12:00 | 3.5 | 3.08 | 1,744 | 2017 |
| 01/01/2017 | 10:28 | 01/01/2017 10:05 | 01/01/2017 12:40 | 2.6 | 4.25 | 4,897 | 2017 |
| 12/22/2016 | 13:44 | 12/22/2016 13:19 | 12/22/2016 15:29 | 2.2 | 3.55 | 2,835 | 2017 |
| Flood Flow Frequency View a plot of Flood Frequncy Data ***NOTE: Flood Flow Frequency data are for information only and should not be considered valid for regulation*** Magnitude and Probability of Instantaneous Peak Flow | Discharge, in cfs, for indicated Recurrence Interval |
|||||||
| FEMA Flood Flood Insurance Study at CAP Canal |
|||||||
| 2-year | 5-year | 10-year | 20-year | 50-year | 100-year | 200-year | 500-year |
| --- | --- | --- | --- | --- | 26,700 | --- | --- |
| Crest Gage Number | Pin Elevation (Feet, Gage Height) |
Additional Information |
| 1 | 2.30 | Located near transducer gage |