
Page Last Updated: 04 November 2025
|
|
Page Last Updated: 04 November 2025 |
| ID | Elevation of Instrument in Gage Height |
Elevation of Instrument in Datum |
Period |
| 62213 | 23.76 feet | 1,513.76 feet NAVD88 | 12/12/2019 -- Current |
| STATUS | Active |
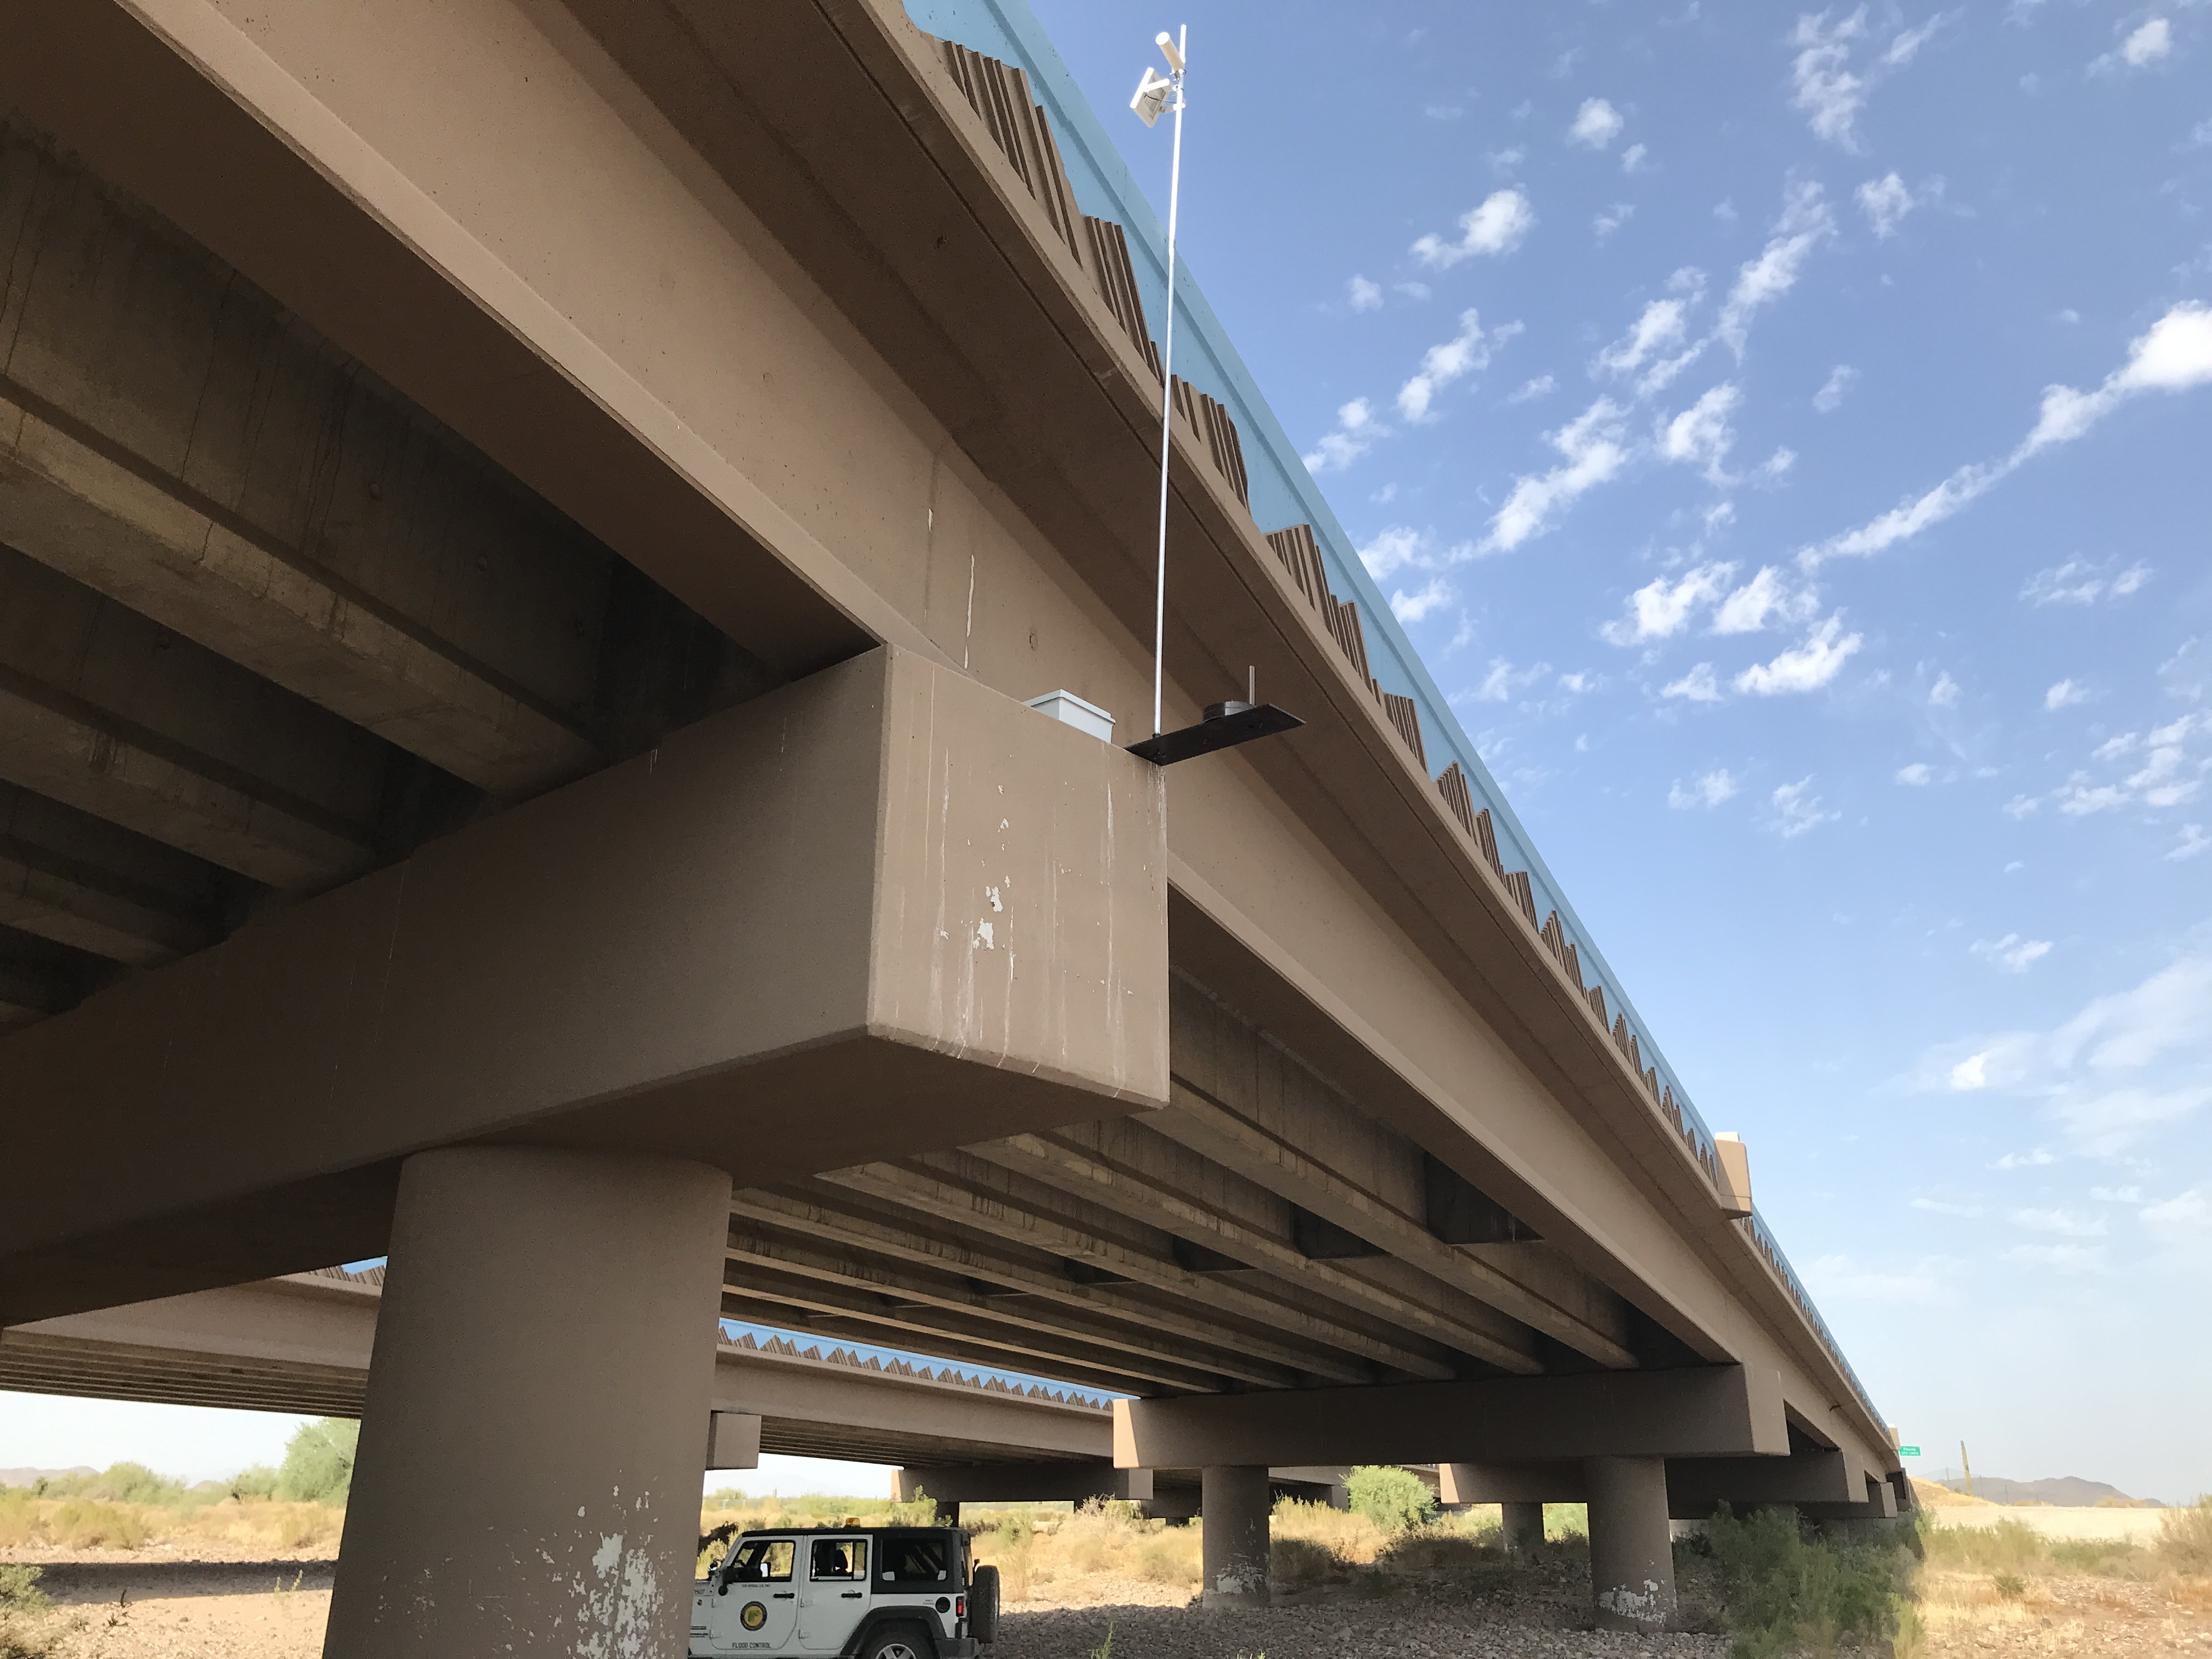
| LOCATION | On the westbound Loop 303 bridge |
| DRAINAGE AREA | 122.2 mi2 |
| STREAM TYPE | Natural Stream |
| JURISDICTION | Peoria, Arizona |
| WATERSHED | Upper New River |
| SECTION/TOWNSHIP/RANGE | S14 T5N R1E |
| LATITUDE | N 33° 38' 16.6" | +33.63795 |
| LONGITUDE | W 112° 14' 22.5" | -112.23959 |
| ARIZONA STATE PLANE | E 606540 | N 1011220 |
| USGS QUAD SHEET | Biscuit Flat 7.5-Minute |
| STREAMGAGE INSTALLATION DATE | 12/12/2019 - WY 2020 |
| PERIOD OF AVAILABLE DATA RECORD | 12/12/2019 - Current |
| LENGTH OF AVAILABLE DATA RECORD (AS OF 10/01/2024) | 4.80 Years | 1,755 Days |
| GAPS (> 2 DAYS) IN RECORD | None |
| STAGE GAGE TYPE | RADAR |
| STAGE GAGE ELEVATION | 23.76 feet Gage Height |
| STAFF GAGES | 0 |
| CREST STAGE GAGES | 1 |
| ZERO GAGE HEIGHT ELEVATION | 1,490.000 feet NAVD88 |
| POINT OF ZERO FLOW | 2.0 feet Gage Height |
| EXTREME FOR PERIOD OF RECORD | 5,483 cfs | 5.46 feet | 07/23/2021 |
| EXTREME OUTSIDE PERIOD OF RECORD | 46,000 cfs | 08/19/2014 |
| Current Rating = #1 - Applied since 12/12/2019 | ||
| Discharge (cfs) |
Elevation feet, Gage Height |
Elevation feet, NAVD88 |
| 0 | 0.00 | 1,490.00 |
| 100 | 2.87 | 1,492.87 |
| 500 | 3.51 | 1,493.51 |
| 1,000 | 3.92 | 1,493.92 |
| 2,000 | 4.41 | 1,494.41 |
| 5,000 | 5.34 | 1,495.34 |
| 10,000 | 6.40 | 1,496.40 |
| 20,000 | 7.89 | 1,497.89 |
| 30,000 | 9.07 | 1,499.07 |
| Water Year |
Peak Gage Height (feet) |
Peak Discharge (cfs) |
Date of Peak |
| 2026 | |||
| 2025 | None | 0 | None |
| 2024 | None | 0 | None |
| 2023 | ~5.22 | 4,500 | 09/01/2023 |
| 2022 | None | 0 | None |
| 2021 | 5.46 | 5,483 | 07/23/2021 |
| 2020 (partial) | 4.81 | 3,107 | 03/13/2020 |
| Date of Peak |
Time of Peak |
Runoff Start |
Runoff End |
Duration (hours) |
Peak Stage (feet GH) |
Peak Discharge (CFS) |
Water Year |
| View a Plot of These Data | |||||||
| 09/01/2023 | Date | Unavailable | ~5.22 | ~4,572 | 2023 | ||
| 07/23/2021 | Data | Unavailable | 5.46 | 5,483 | 2021 | ||
| 03/19/2020 | 18:00 | 03/19/2020 00:25 | 03/20/2020 12:00 | 35.6 | 3.84 | 888 | 2020 |
| 03/13/2020 | 08:05 | 03/13/2020 08:05 | 03/15/2020 06:00 | 45.9 | 4.81 | 3,107 | 2020 |
| 12/27/2019 | 14:55 | 12/27/2019 14:45 | 12/27/2019 16:25 | 1.7 | 3.75 | 764 | 2020 |
| 12/25/2019 | 06:20 | 12/25/2019 06:15 | 12/25/2019 16:50 | 10.6 | 3.78 | 806 | 2020 |
| Flood Flow Frequency View a plot of Flood Frequncy Data ***NOTE: Flood Flow Frequency data are for information only and should not be considered valid for regulation*** Magnitude and Probability of Instantaneous Peak Flow | Discharge, in cfs, for indicated Recurrence Interval |
|||||||
| USGS StreamStats Flood Flow Frequency | |||||||
| 2-year | 5-year | 10-year | 25-year | 50-year | 100-year | 200-year | 500-year |
| Crest Gage Number | Pin Elevation (Feet, Gage Height) |
Additional Information |
| 1 | 4.31 | Located on pier #3 on upstream bridge |