
Page Last Updated: 10 Janurary 2023
|
|
Page Last Updated: 10 Janurary 2023 |
| ID | Elevation of Instrument in Gage Height |
Elevation of Instrument in Datum |
Period |
| 5807 | -0.35 feet | 974.76 feet NAVD88 | 03/25/2020 -- Current |
| 4758 | -0.35 feet | 974.86 feet NAVD88 | 07/14/2008 -- 03/25/2020 |
| STATUS | Active |
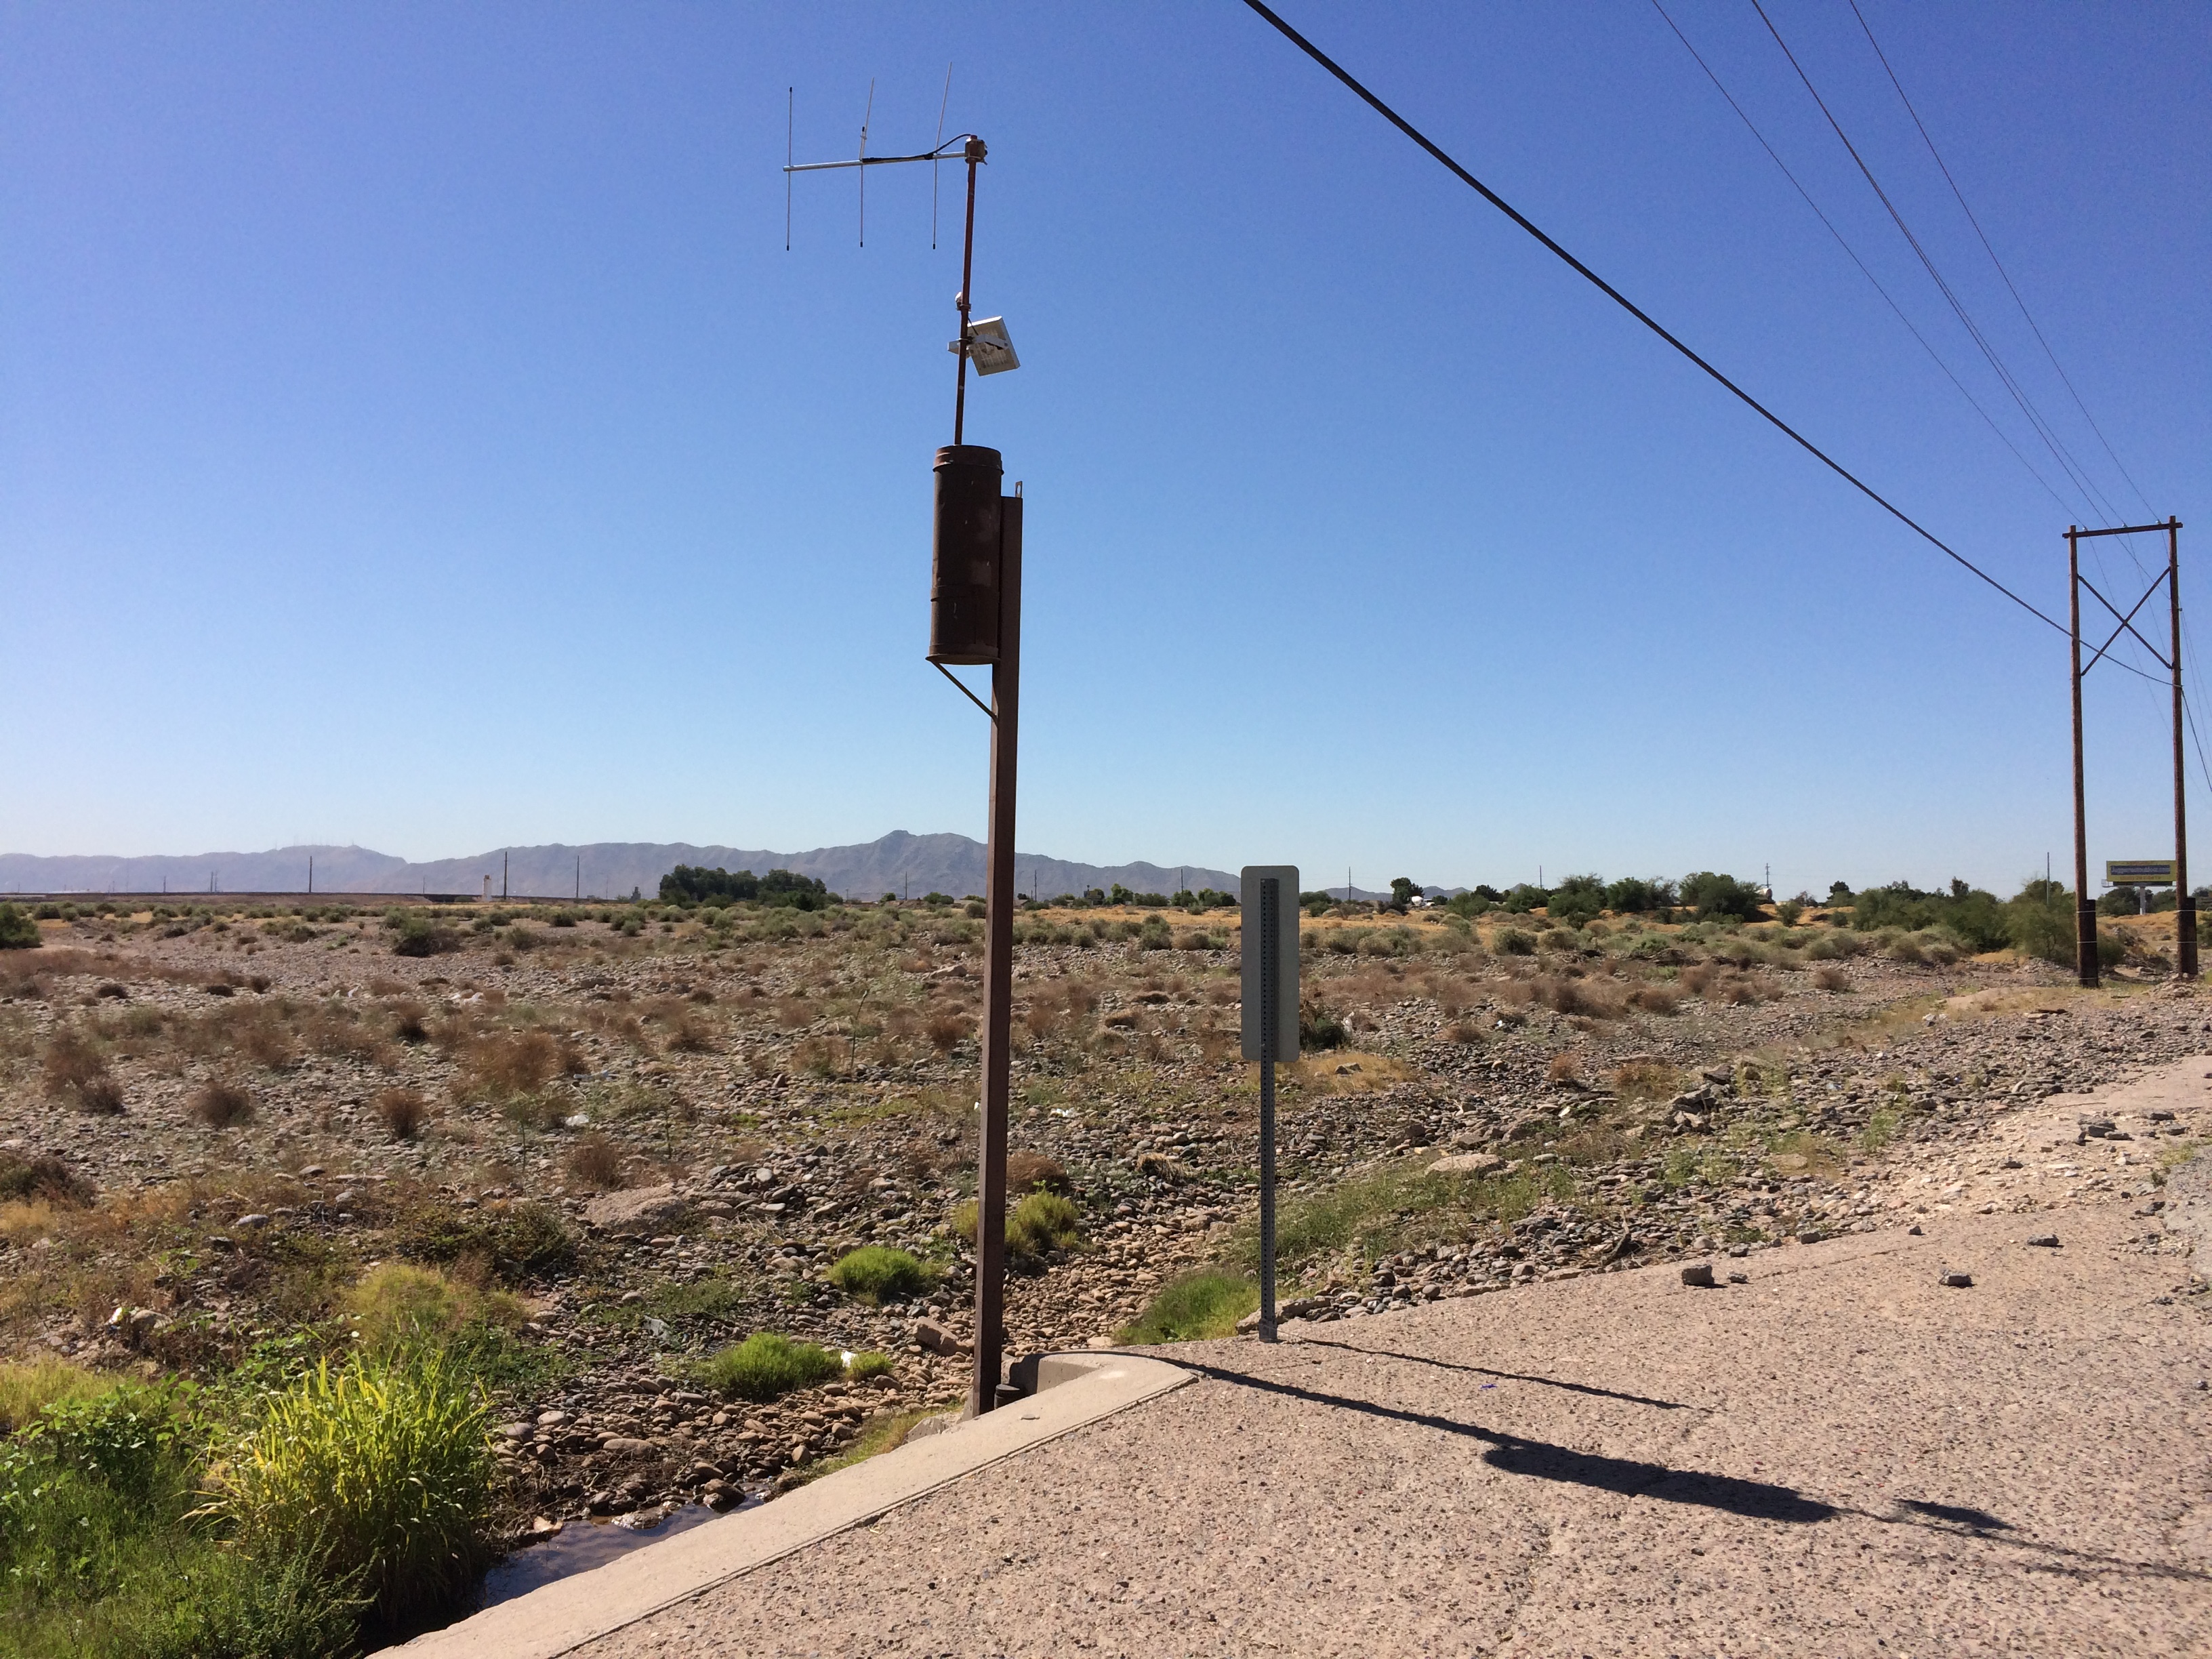
| LOCATION | Located at the 67th Avenue crossing of the Salt River |
| DRAINAGE AREA | 13,434 mi2 |
| STREAM TYPE | Culvert in Channelized Natural Stream |
| JURISDICTION | Maricopa County, Arizona |
| WATERSHED | Salt |
| SECTION/TOWNSHIP/RANGE | S30 T1N R2E |
| LATITUDE | N 33° 23' 51.8" | +33.39773 |
| LONGITUDE | W 112° 12' 12.6" | -112.20351 |
| ARIZONA STATE PLANE | E 612465 | N 872360 |
| USGS QUAD SHEET | Fowler 7.5-Minute |
| STREAMGAGE INSTALLATION DATE | 07/14/2008 - WY 2008 |
| PERIOD OF AVAILABLE DATA RECORD | 07/14/2008 - Current |
| LENGTH OF AVAILABLE DATA RECORD (AS OF 10/01/2021) | 13.22 Years | 4,827 Days |
| GAPS (> 2 DAYS) IN RECORD | None |
| STAGE GAGE TYPE | Pressure Transducer |
| STAGE GAGE ELEVATION | -0.35 feet Gage Height |
| STAFF GAGES | None |
| CREST STAGE GAGES | None |
| ZERO GAGE HEIGHT ELEVATION | 975.107 feet NAVD88 |
| POINT OF ZERO FLOW | 0.00 feet Gage Height |
| Current Rating = #1 - Applied since 07/14/2008 | ||
| Discharge (cfs) |
Elevation feet Gage Height |
Elevation feet Gage Height |
| 0 | 0.00 | 975.11 |
| 235 | 2.13 | 977.24 |
| 390 | 3.20 | 978.31 |
| 555 | 4.60 | 979.71 |
| 1,330 | 5.87 | 980.98 |
| 3,150 | 6.87 | 981.98 |
| 5,780 | 7.87 | 982.98 |
| 9,080 | 8.87 | 983.98 |
| 13,020 | 9.87 | 984.98 |
| 17,550 | 10.87 | 985.98 |
| Water Year |
Peak Gage Height (feet) |
Peak Discharge (cfs) |
Date of Peak |
| 2023 | |||
| 2022 | None | 0 | None |
| 2021 | 1.68 | 81 | 08/14/2021 |
| 2020 | 5.49 | 552 | 03/24/2020 |
| 2019 | 6.86 | 3,985 | 03/05/2019 |
| 2018 | None | 0 | None |
| 2017 | 7.96 | 8,953 | 03/01/2017 |
| 2016 | None | 0 | None |
| 2015 | None | 0 | None |
| 2014 | 1.78 | 91 | 09/08/2014 |
| 2013 | None | 0 | None |
| 2012 | None | 0 | None |
| 2011 | 1.32 | 140 | 06/16/2011 |
| 2010 | 9.43 | 17,847 | 01/22/2010 |
| 2009 | 6.03 | 1,556 | 02/17/2009 |
| 2008 | 1.10 | 43 | 08/28/2008 |
| Date of Peak |
Time of Peak |
Runoff Start |
Runoff End |
Duration (hours) |
Peak Stage (feet GH) |
Peak Discharge (CFS) |
Water Year |
| View a Plot of These Data | |||||||
| 08/14/2021 | 01:53 | 08/14/2021 00:53 | 08/14/2021 09:06 | 8.2 | 1.68 | 81 | 2021 |
| 03/24/2020 | 21:40 | 03/24/2020 18:56 | 03/31/2020 12:00 | 161.1 | 5.49 | 552 | 2020 |
| 03/15/2019 | 03:43 | 03/09/2019 21:51 | 03/23/2019 06:00 | 320 | 6.61 | 3,170 | 2019 |
| 03/05/2019 | 06:00 | 03/05/2019 03:19 | 03/09/2019 06:00 | 98.7 | 6.86 | 3,985 | 2019 |
| 03/01/2017 | 23:17 | 03/01/2017 15:49 | 03/16/2017 07:47 | 352 | 7.96 | 8,953 | 2017 |
| 09/08/2014 | 08:39 | 09/08/2014 05:36 | 09/08/2014 14:53 | 9.3 | 1.78 | 91 | 2014 |
| 06/16/2011 | 07:03 | 1.32 | 140 | 2011 | |||
| 03/10/2010 | 19:00 | Hourly Maximum | 8.25 | 10,695 | 2010 | ||
| 02/12/2010 | 03:00 | Hourly Maximum | 6.32 | 2,040 | 2010 | ||
| 01/22/2010 | 13:00 | Hourly Maximum | 9.43 | 17,847 | 2010 | ||
| 03/03/2009 | 18:43 | 03/03/2009 00:51 | 03/28/2009 00:00 | 599 | 3.60 | 442 | 2009 |
| 02/17/2009 | 03:44 | 02/16/2009 07:59 | 03/01/2009 16:21 | 320 | 6.03 | 1,556 | 2009 |
| Flood Flow Frequency View a plot of Flood Frequncy Data ***NOTE: Flood Flow Frequency data are for information only and should not be considered valid for regulation*** Magnitude and Probability of Instantaneous Peak Flow | Discharge, in cfs, for indicated Recurrence Interval |
|||||||
| Analysis of Modified Roosevelt Dam | |||||||
| 2-year | 5-year | 10-year | 20-year | 50-year | 100-year | 200-year | 500-year |
| ----- | 20,500 | 55,000 | 90,000 | 140,000 | 169,000 | ----- | ----- |
| USGS StreamStats Flood Flow Frequency | |||||||
| 2-year | 5-year | 10-year | 25-year | 50-year | 100-year | 200-year | 500-year |