
Page Last Updated: 04 November 2025
|
|
Page Last Updated: 04 November 2025 |
| ID | Elevation of Instrument in Gage Height |
Elevation of Instrument in Datum |
Period |
| 5307 | 1.90 feet | 988.51 feet NAVD88 | 03/20/2020 -- Current |
| 4753 | 1.90 feet | 988.51 feet NAVD88 | 10/01/2018 -- 03/20/2020 |
| 4753 | 1.60 feet | 1,051.60 feet NGVD 1929 | 04/27/2011 -- 09/30/2018 |
| STATUS | Active |
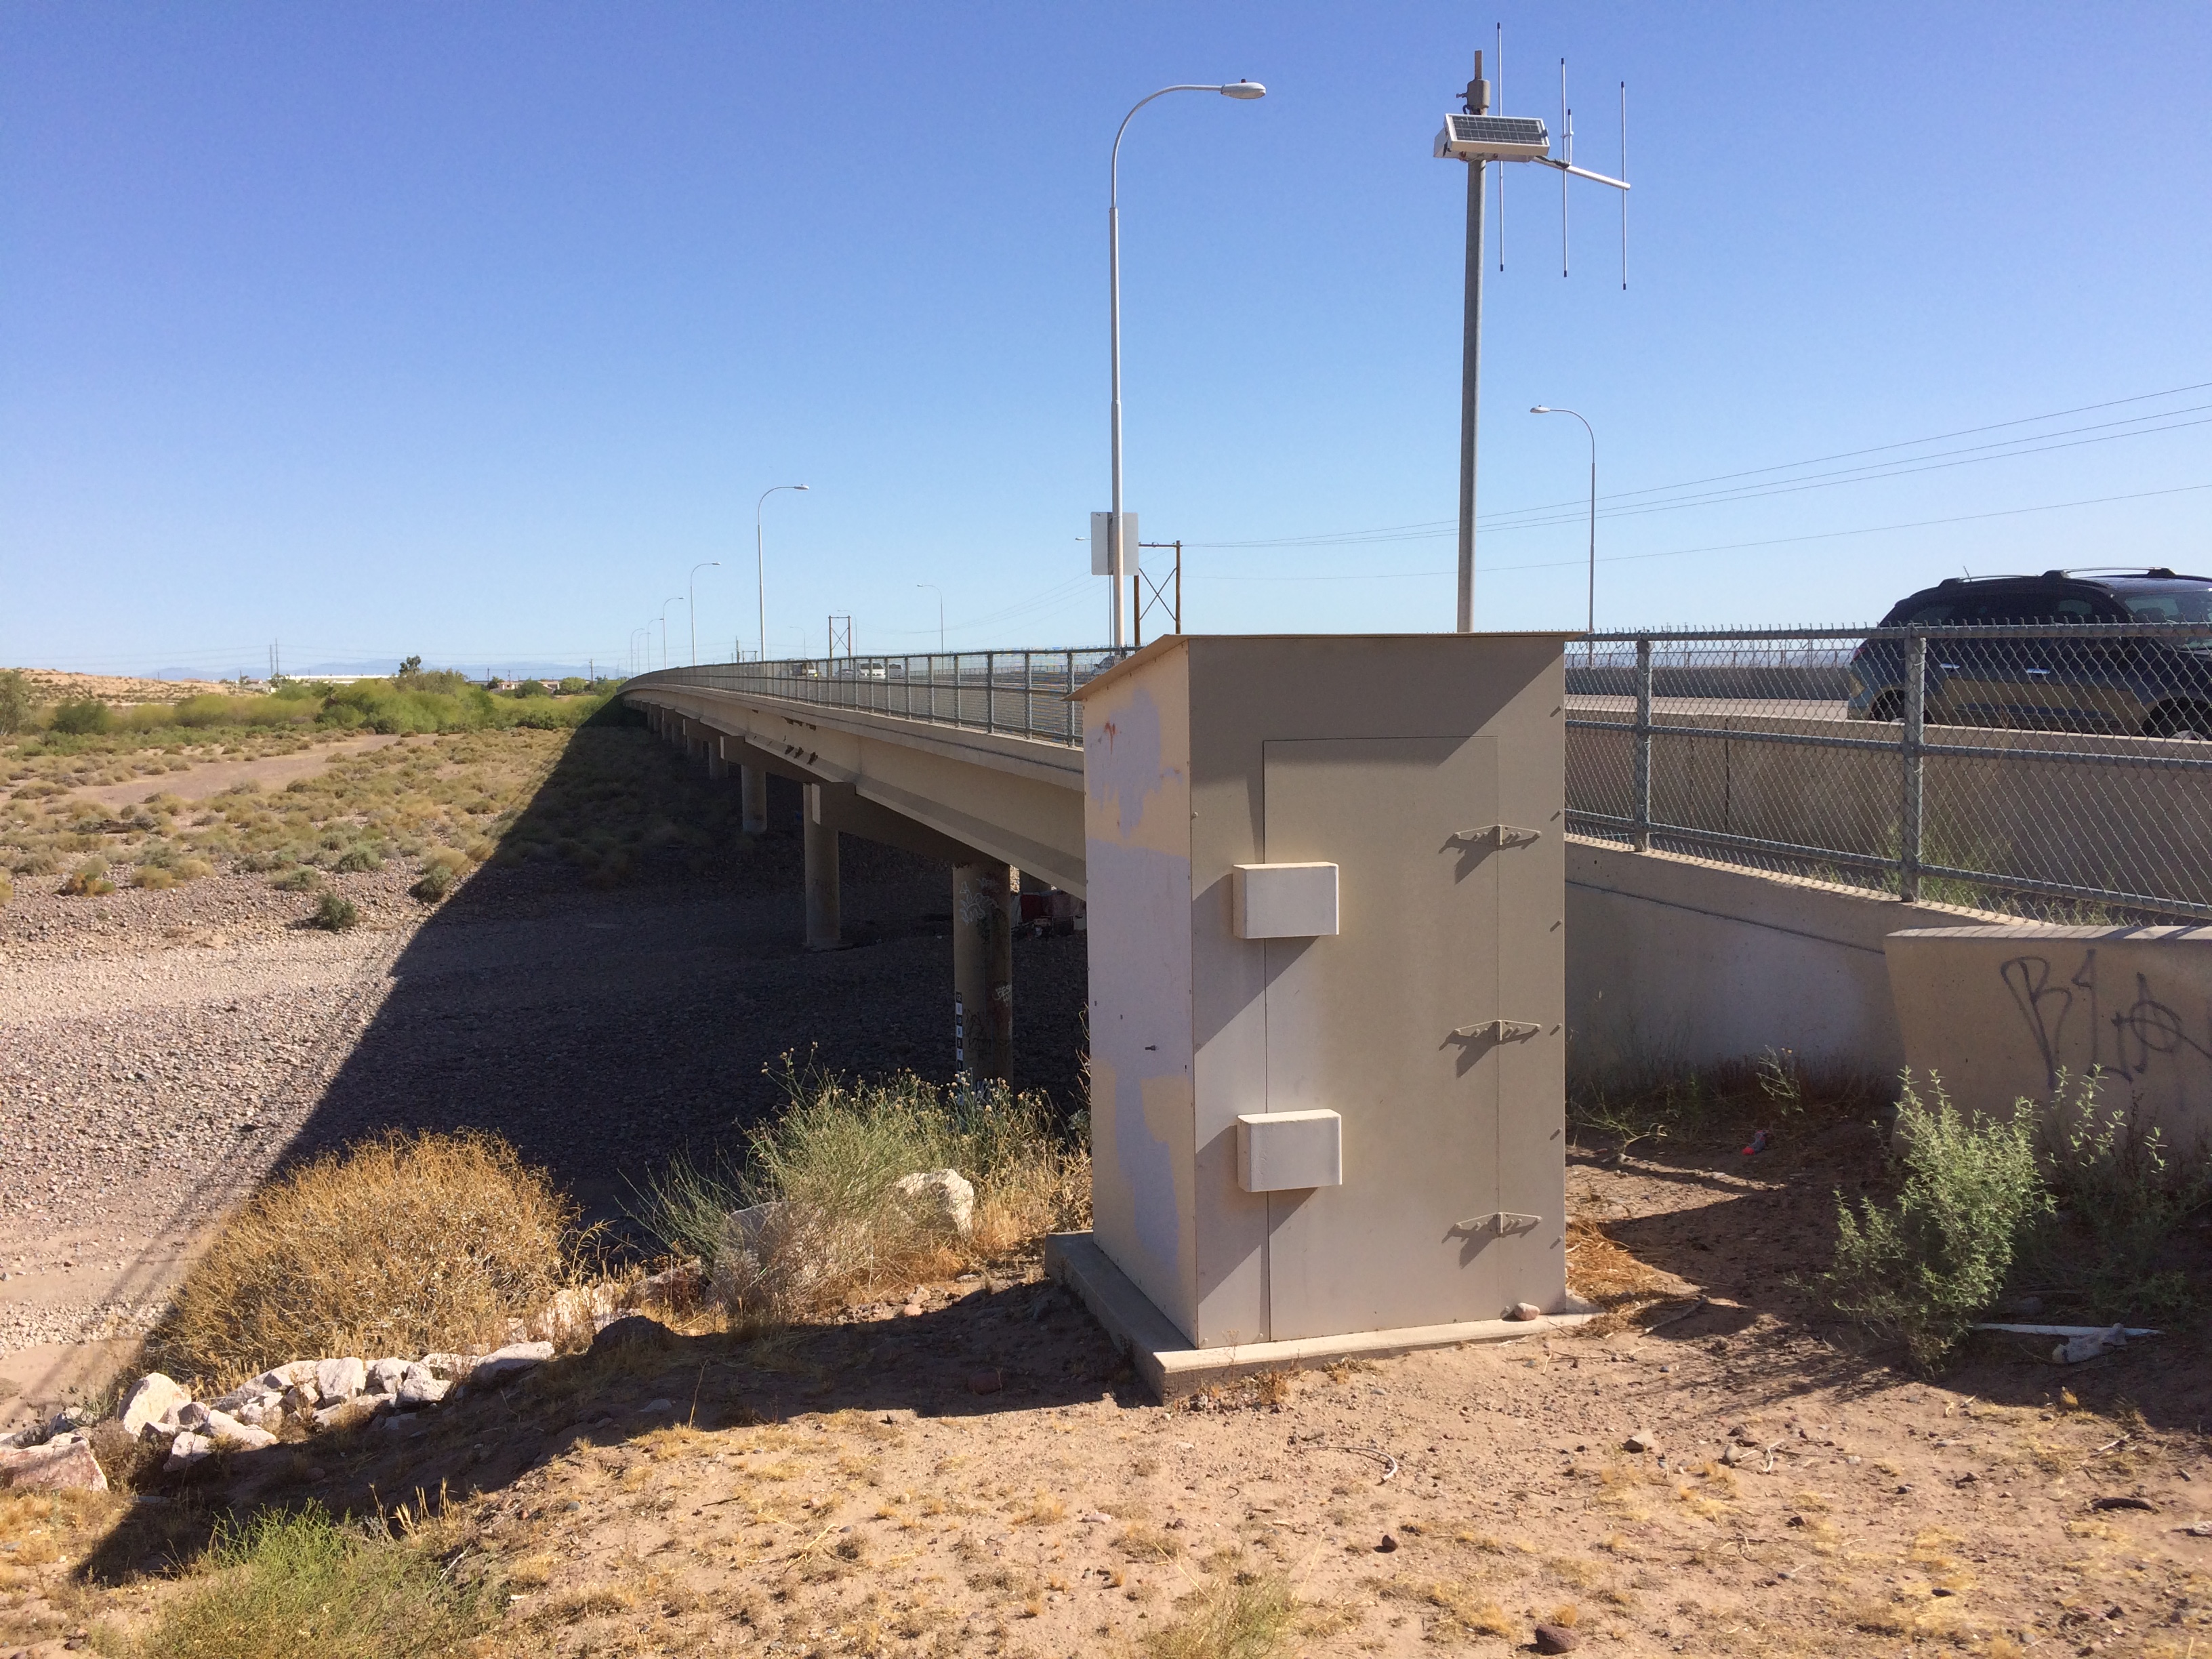
| LOCATION | Located at the 51st Avenue crossing of the Salt River |
| DRAINAGE AREA | 13,052 mi 2 |
| STREAM TYPE | Channelized Natural Stream |
| JURISDICTION | Phoenix, Arizona |
| WATERSHED | Lower ACDC |
| SECTION/TOWNSHIP/RANGE | S29 T1N R2E |
| LATITUDE | N 33° 23' 54.6" | +33.3985 |
| LONGITUDE | W 112° 10' 22.5" | -112.1729 |
| ARIZONA STATE PLANE | E 623130 | N 875025 |
| USGS QUAD SHEET | Fowler 7.5-Minute |
| STREAMGAGE INSTALLATION DATE | 04/27/2011 - WY 2011 |
| PERIOD OF AVAILABLE DATA RECORD | 04/27/2011 - Current |
| LENGTH OF AVAILABLE DATA RECORD (AS OF 10/01/2024) | 13.43 Years | 4,906 Days |
| GAPS (> 2 DAYS) IN RECORD | None |
| STAGE GAGE TYPE | Gas Purge Non Submersible Transducer |
| STAGE GAGE ELEVATION | 1.90 feet Gage Height |
| STAFF GAGES | 2 |
| CREST STAGE GAGES | 3 |
| ZERO GAGE HEIGHT ELEVATION | 986.611 feet NAVD88 |
| POINT OF ZERO FLOW | 1.5 feet Gage Height |
| EXTREME FOR PERIOD OF RECORD | 15.21 Feet | 39,432 CFS | 03/23/2023 |
| Current Rating = #1 - Applied since 04/27/2011 | ||
| Discharge (cfs) |
Elevation feet Gage Height |
Elevation feet Gage Height |
| 0 | 0.00 | 986.61 |
| 8 | 2.00 | 988.61 |
| 407 | 4.00 | 990.61 |
| 1,745 | 6.00 | 992.61 |
| 4,756 | 8.00 | 994.61 |
| 9,729 | 10.00 | 996.61 |
| 17,773 | 12.00 | 998.61 |
| 29,841 | 14.00 | 1,000.61 |
| 46,749 | 16.00 | 1,002.61 |
| 69,461 | 18.00 | 1,004.61 |
| Water Year |
Peak Gage Height (feet) |
Peak Discharge (cfs) |
Date of Peak |
| 2026 | |||
| 2025 | None | 0 | None |
| 2024 | None | 0 | None |
| 2023 | 15.21 | 39,432 | 03/23/2023 |
| 2022 | None | 0 | None |
| 2021 | 5.10 | 974 | 12/10/2020 |
| 2020 | 4.20 | 485 | 03/24/2020 |
| 2019 | 5.80 | 1,545 | 03/15/2019 |
| 2018 | 3.10 | 163 | 08/02/2018 |
| 2017 | 10.50 | 11,376 | 03/01/2017 |
| 2016 | None | 0 | None |
| 2015 | None | 0 | None |
| 2014 | 5.62 | 1,380 | 09/08/2014 |
| 2013 | None | 0 | None |
| 2012 | None | 0 | None |
| 2011 (partial) | None | 0 | None |
| Date of Peak |
Time of Peak |
Runoff Start |
Runoff End |
Duration (hours) |
Peak Stage (feet GH) |
Peak Discharge (CFS) |
Water Year |
| View a Plot of These Data | |||||||
| 05/05/2023 | 16:16 | 05/04/2023 12:00 | 05/09/2023 00:00 | 108.0 | 3.42 | 232 | 2023 |
| 03/23/2023 | 20:39 | 03/20/2023 06:00 | 05/01/2023 19:46 | 1021.8 | 15.21 | 39,432 | 2023 |
| 03/02/2023 | 00:33 | 03/01/2023 19:24 | 03/02/2023 08:06 | 12.7 | 3.09 | 161 | 2023 |
| 01/16/2023 | 12:00 | 01/15/2023 12:00 | 01/18/2023 18:00 | 78.0 | 2.41 | 33 | 2023 |
| 12/28/2022 | 13:45 | 12/28/2022 09:01 | 01/01/2023 09:01 | 96.0 | 2.84 | 119 | 2023 |
| 10/15/2022 | 23:35 | 10/15/2022 12:00 | 10/18/2022 12:00 | 72.0 | 2.40 | 31 | 2023 |
| 08/14/2021 | 02:25 | 08/14/2021 01:35 | 08/15/2021 18:00 | 40.4 | 3.99 | 404 | 2021 |
| 07/25/2021 | 18:00 | 07/25/2021 16:35 | 07/28/2021 00:00 | 55.4 | 2.80 | 113 | 2021 |
| 12/10/2020 | 12:00 | 12/10/2020 11:10 | 12/13/2020 06:00 | 66.8 | 5.10 | 974 | 2021 |
| 03/24/2020 | 06:00 | 03/23/2020 12:13 | 04/01/2020 12:00 | 215.8 | 4.20 | 485 | 2020 |
| 03/15/2019 | 06:00 | 03/09/2019 23:00 | 03/24/2019 06:00 | 343 | 5.80 | 1545 | 2019 |
| 03/04/2019 | 18:00 | 03/04/2019 11:15 | 03/09/2019 00:00 | 109 | 5.70 | 1451 | 2019 |
| 08/12/2018 | 14:23 | 08/02/2018 14:23 | 08/02/2018 15:15 | 0.9 | 3.10 | 163 | 2018 |
| 03/01/2017 | 23:50 | 03/01/2017 11:26 | 03/16/2017 12:00 | 361 | 10.50 | 11,376 | 2017 |
| 09/08/2014 | 16:08 | 09/08/2014 05:32 | 09/09/2014 08:45 | 27.2 | 5.62 | 1,380 | 2014 |
| Flood Flow Frequency View a plot of Flood Frequncy Data ***NOTE: Flood Flow Frequency data are for information only and should not be considered valid for regulation*** Magnitude and Probability of Instantaneous Peak Flow | Discharge, in cfs, for indicated Recurrence Interval |
|||||||
| Analysis of Modified Roosevelt Dam | |||||||
| 2-year | 5-year | 10-year | 20-year | 50-year | 100-year | 200-year | 500-year |
| ----- | 20,500 | 55,000 | 90,000 | 140,000 | 169,000 | ----- | ----- |
| Staff Gage Range | Staff Gage Information |
| 2-sections, Staff Plates | |
| 1.50 - 13.60 | Located on pier with transducer Displays in Gage Height NOTE: Not readable from any bank |
| Painted staff Gage | |
| 0 - 12 | Painted on pier, viewable from south bank Zero GH on painted staff gage equals 2.50 feet GH on staff plates |
| Crest Gage Number | Pin Elevation (Feet, Gage Height) |
Additional Information |
| 1 | 7.54 | Lower CSG on instrumentation pier 1 |
| 2 | 12.41 | Middle CSG on instrumentation pier 1 |
| 3 | 17.02 | Upper CSG on instrumentation pier 1 |