
Page Last Updated: 23 October 2024
|
|
Page Last Updated: 23 October 2024 |
| ID | Elevation of Instrument in Gage Height |
Elevation of Instrument in Datum |
Period |
| 89207 | 0.60 feet | 976.14 feet NAVD88 | 03/18/2025 -- Current |
| 89207 | 0.40 feet | 973.95 feet NAVD88 | 12/13/2017 -- 03/18/2025 |
| STATUS | Active Alert2 Station |
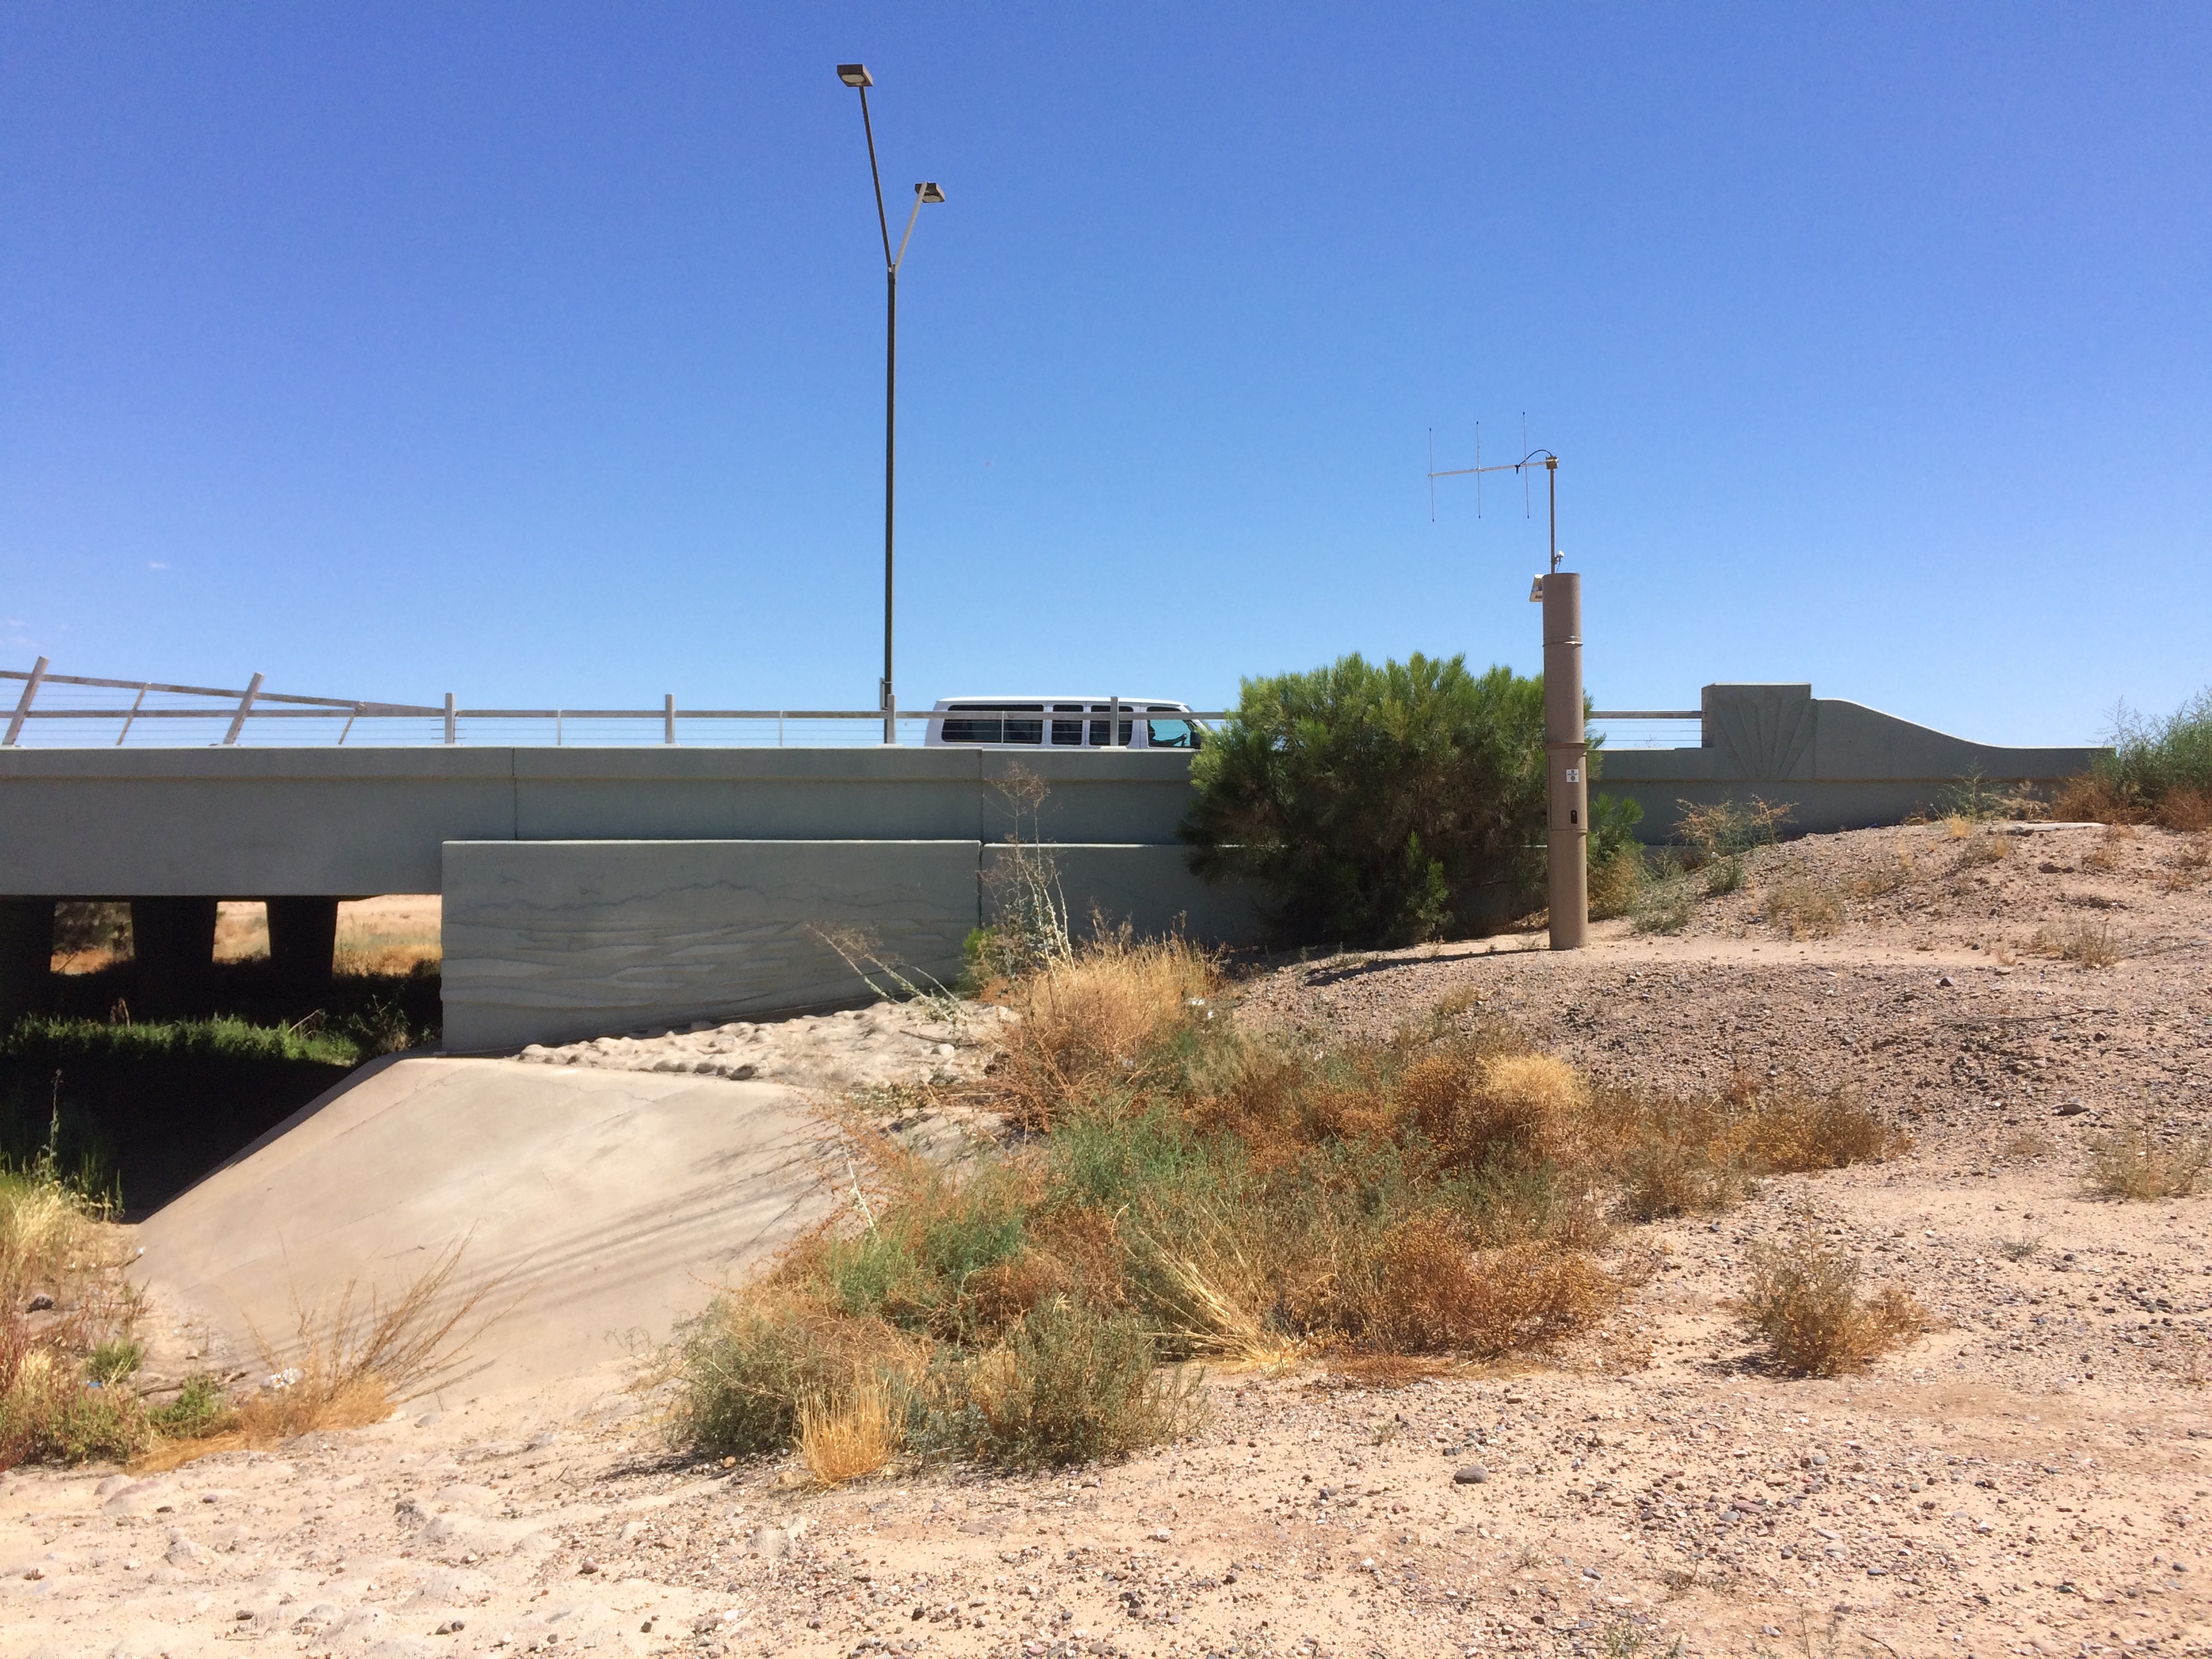
| LOCATION | Located at the northwest corner of Van Buren Street and the Bullard Wash |
| DRAINAGE AREA | 88.3 mi2 via 2001 FIS |
| STREAM TYPE | Channelized Natural Wash |
| JURISDICTION | Goodyear, Arizona |
| WATERSHED | White Tanks B |
| SECTION/TOWNSHIP/RANGE | S05 T1N R1W |
| LATITUDE | N 33° 27' 0.4" | +33.4501 |
| LONGITUDE | W 112° 22' 58.0" | -112.38279 |
| ARIZONA STATE PLANE | E 557835 | N 891610 |
| USGS QUAD SHEET | Perryville 7.5-Minute |
| STREAMGAGE INSTALLATION DATE | 12/13/2017 - WY 2018 |
| PERIOD OF AVAILABLE DATA RECORD | 12/13/2017 - Current |
| LENGTH OF AVAILABLE DATA RECORD (AS OF 10/01/2024) | 6.80 Years | 2,484 Days |
| GAPS (> 2 DAYS) IN RECORD | None |
| STAGE GAGE TYPE | Pressure Transducer |
| STAGE GAGE ELEVATION | 0.40 feet Gage Height |
| STAFF GAGES | None |
| CREST STAGE GAGES | None |
| ZERO GAGE HEIGHT ELEVATION | 973.554 feet NAVD88 |
| POINT OF ZERO FLOW | 1.50 feet Gage Height |
| EXTREME FOR PERIOD OF RECORD | 130 CFS | 2.73 feet GH | 08/14/2021 |
| Current Rating = #1 - Applied since 12/13/2017 | ||
| Discharge (cfs) |
Elevation feet Gage Height |
Elevation feet NAVD88 |
| 0 | 0.00 | 973.55 |
| 50 | 2.28 | 975.83 |
| 100 | 2.58 | 976.13 |
| 200 | 3.00 | 976.55 |
| 500 | 3.82 | 977.37 |
| 700 | 4.26 | 977.81 |
| 1,000 | 4.74 | 978.29 |
| 1,500 | 5.37 | 978.92 |
| 2,000 | 5.90 | 979.45 |
| Water Year |
Peak Gage Height (feet) |
Peak Discharge (cfs) |
Date of Peak |
| 2025 | |||
| 2024 | None | 0 | None |
| 2023 | 1.55 | 0 | 02/25/2023 |
| 2022 | 1.65 | 2 | 07/26/2022 |
| 2021 | 2.73 | 130 | 08/14/2021 |
| 2020 | None | 0 | None |
| 2019 | None | 0 | None |
| 2018 (partial) | None | 0 | None |
| Date of Peak |
Time of Peak |
Runoff Start |
Runoff End |
Duration (hours) |
Peak Stage (feet GH) |
Peak Discharge (CFS) |
Water Year |
| View a Plot of These Data | |||||||
| 07/26/2022 | 11:41 | 07/26/2022 08:51 | 07/28/2022 12:00 | 51.1 | 1.65 | 2 | 2022 |
| 08/14/2021 | 06:34 | 08/14/2021 05:35 | 08/14/2021 15:19 | 9.7 | 2.73 | 130 | 2021 |
| Flood Flow Frequency View a plot of Flood Frequncy Data ***NOTE: Flood Flow Frequency data are for information only and should not be considered valid for regulation*** Magnitude and Probability of Instantaneous Peak Flow | Discharge, in cfs, for indicated Recurrence Interval |
|||||||
| FEMA Flood Insurance Study | |||||||
| 2-year | 5-year | 10-year | 20-year | 50-year | 100-year | 200-year | 500-year |
| ----- | ----- | ----- | ----- | ----- | 4,446 | ----- | ----- |
| USGS StreamStats Flood Flow Frequency | |||||||
| 2-year | 5-year | 10-year | 25-year | 50-year | 100-year | 200-year | 500-year |