
Page Last Updated: 04 November 2025
|
|
Page Last Updated: 04 November 2025 |
| ID | Elevation of Instrument in Gage Height |
Elevation of Instrument in Datum |
Period |
| 8107 | 0.70 feet | 1,730.95 feet NAVD88 | 08/16/2016 -- Current |
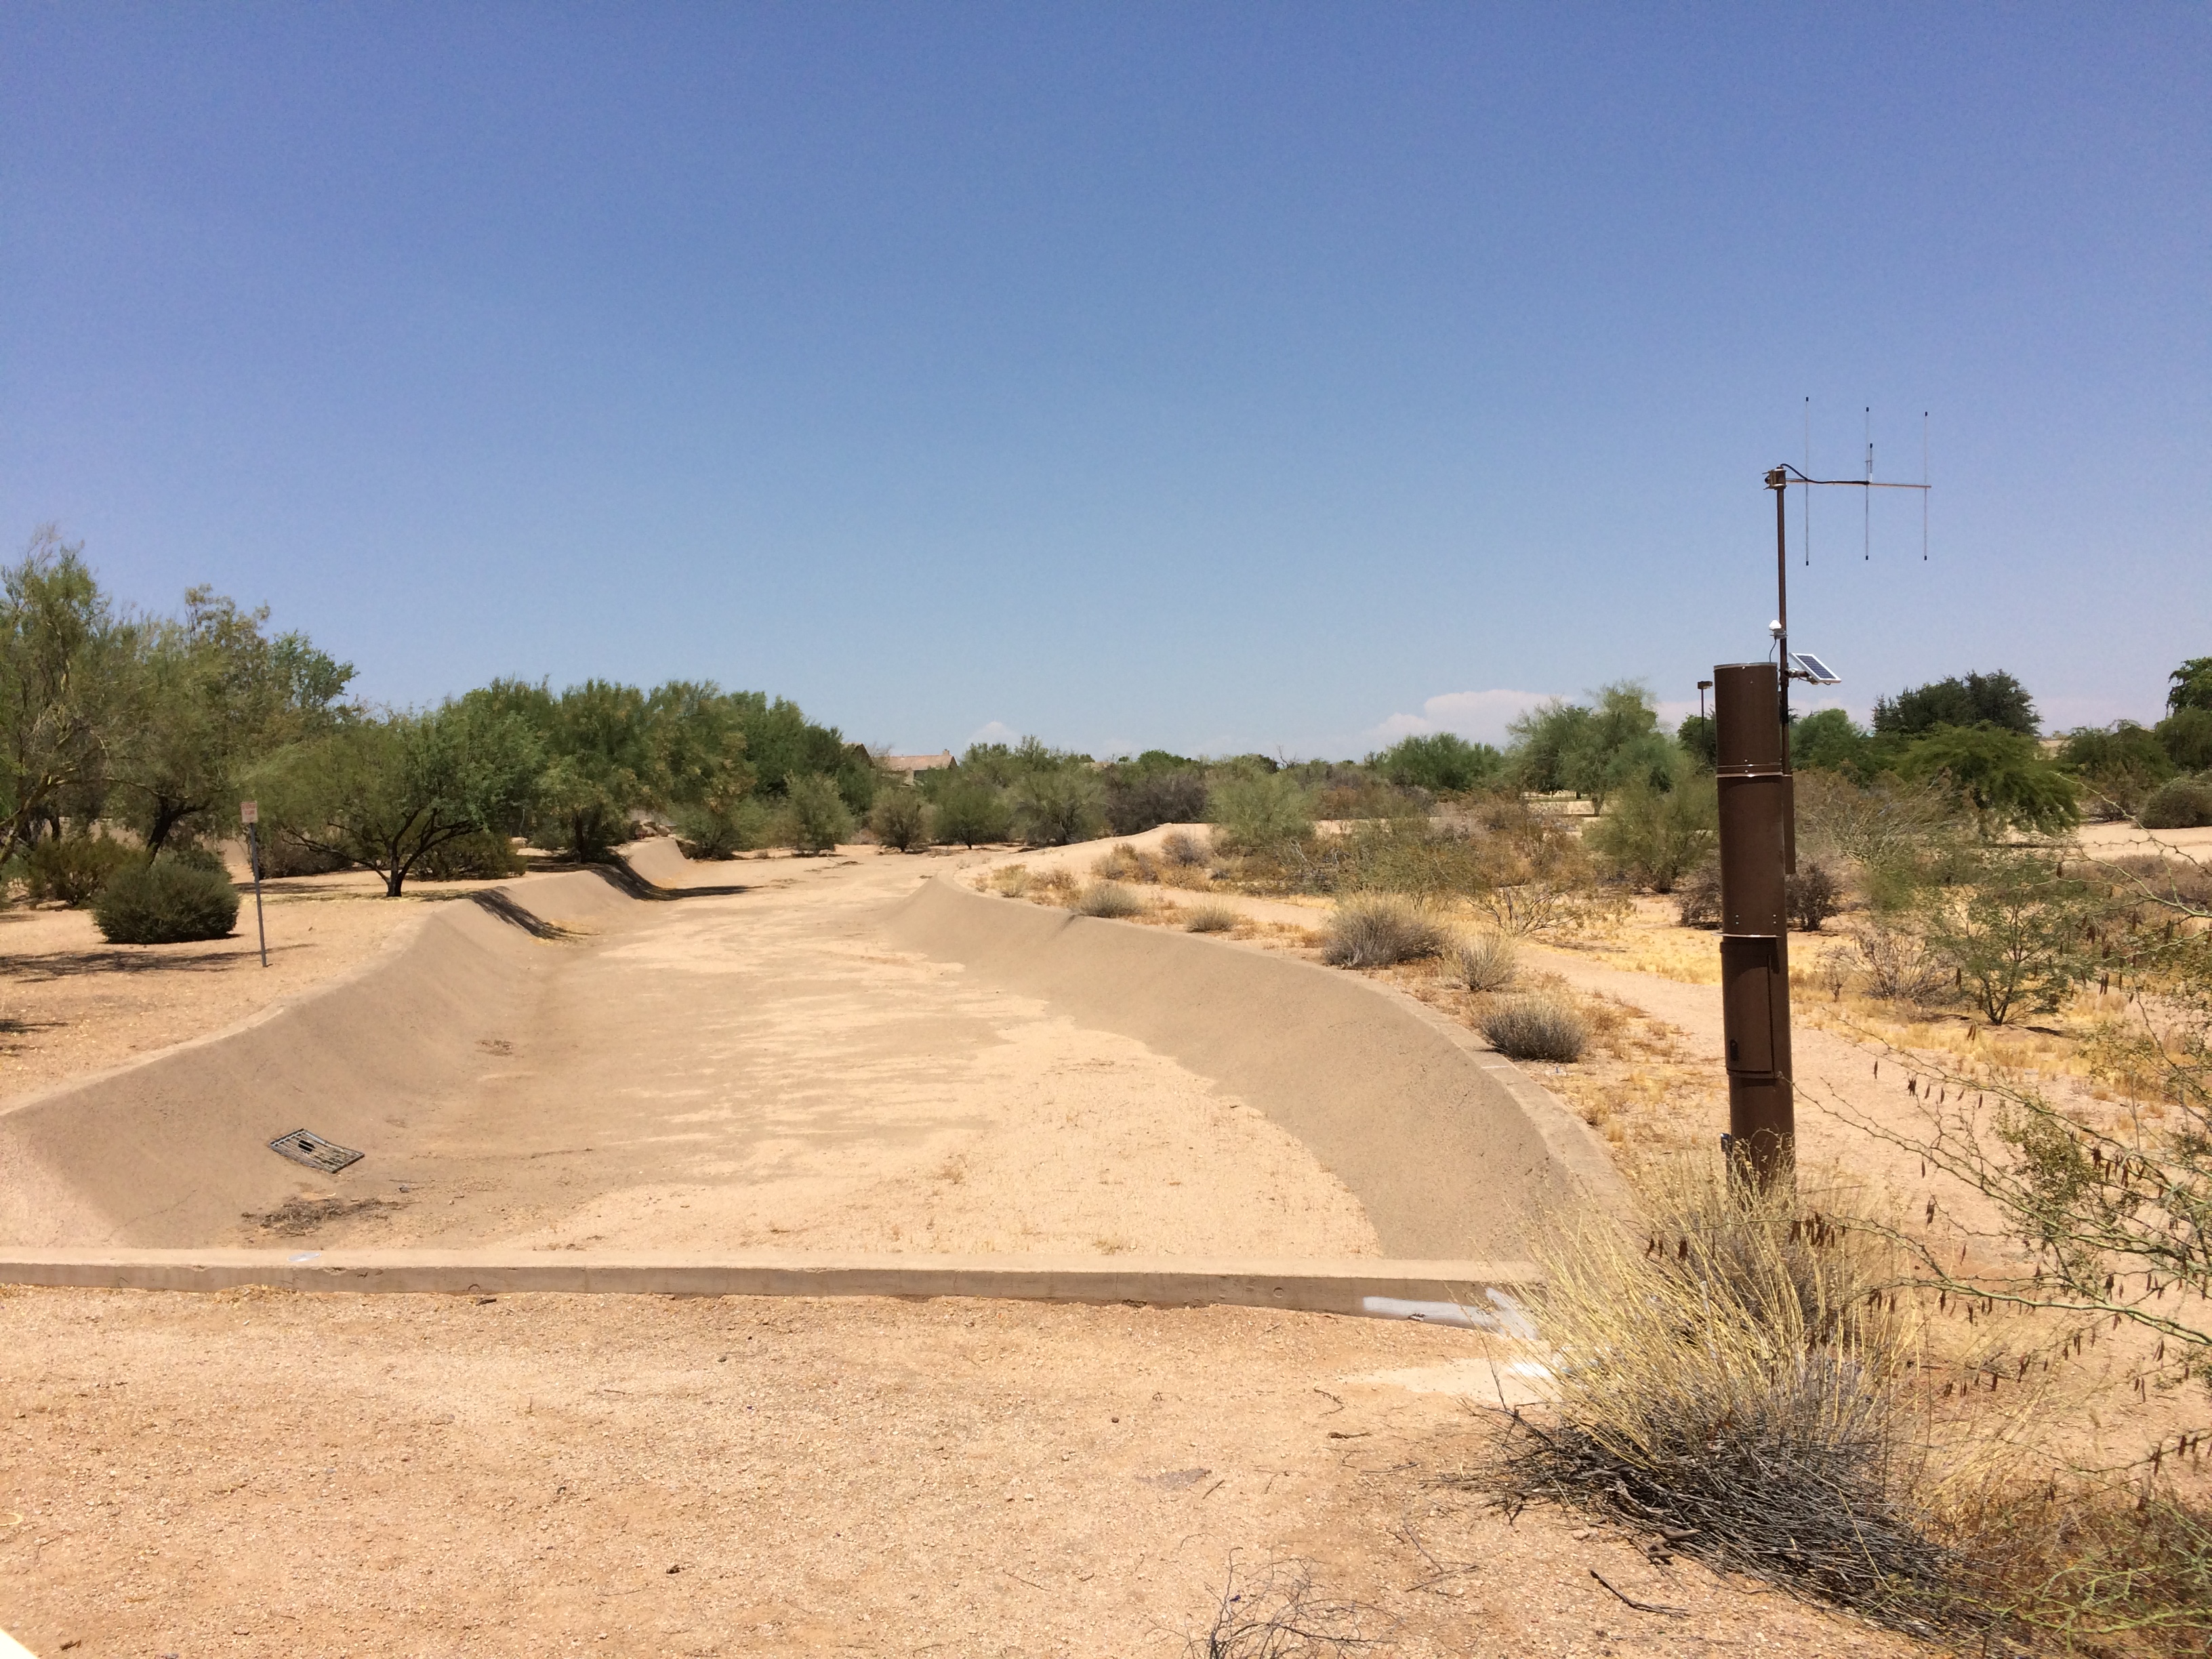
| STATUS | Active Alert2 Station |
| LOCATION | Located at John Teets Park near 43rd Way and Ramuda Drive |
| DRAINAGE AREA | 1.38 mi2 |
| STREAM TYPE | Channelized Natural Stream |
| JURISDICTION | Phoenix, Arizona |
| WATERSHED | Upper Indian Bend Wash |
| SECTION/TOWNSHIP/RANGE | S06 T4N R4E |
| LATITUDE | N 33° 43' 15.9" | +33.72107 |
| LONGITUDE | W 111° 59' 24.0" | -111.99001 |
| ARIZONA STATE PLANE | E 677700 | N 989880 |
| USGS QUAD SHEET | Curry's Corner 7.5-Minute |
| STREAMGAGE INSTALLATION DATE | 06/01/2017 - WY 2017 |
| PERIOD OF AVAILABLE DATA RECORD | 06/01/2017 - Current |
| LENGTH OF AVAILABLE DATA RECORD (AS OF 10/01/2024) | 7.33 Years | 2,679 Days |
| GAPS (> 2 DAYS) IN RECORD | None |
| STAGE GAGE TYPE | Pressure Transducer |
| STAGE GAGE ELEVATION | 0.70 feet Gage Height |
| STAFF GAGES | None |
| CREST STAGE GAGES | None |
| ZERO GAGE HEIGHT ELEVATION | 1,730.253 feet NAVD88 |
| POINT OF ZERO FLOW | 0.0 feet Gage Height |
| EXTREME FOR PERIOD OF RECORD | No Events Recorded |
| Current Rating = #1 - Applied since 06/01/2017 | ||
| Discharge (cfs) |
Elevation feet Gage Height |
Elevation feet NAVD88 |
0 | 0.00 | 1,730.25 | 100 | 1.02 | 1,731.27 | 200 | 1.41 | 1,731.66 | 500 | 2.18 | 1,732.43 | 800 | 2.70 | 1,732.95 | 1,000 | 3.02 | 1,733.27 | 1,500 | 3.75 | 1,734.00 |
| Water Year |
Peak Gage Height (feet) |
Peak Discharge (cfs) |
Date of Peak |
| 2026 | |||
| 2025 | None | 0 | None |
| 2024 | None | 0 | None |
| 2023 | None | 0 | None |
| 2022 | None | 0 | None |
| 2021 | None | 0 | None |
| 2020 | None | 0 | None |
| 2019 | None | 0 | None |
| 2018 | None | 0 | None |
| 2017 (partial) | None | 0 | None |
| Date of Peak |
Time of Peak |
Runoff Start |
Runoff End |
Duration (hours) |
Peak Stage (feet GH) |
Peak Discharge (CFS) |
Water Year |
| View a Plot of These Data | |||||||
| No Runoff Events | Recorded to Date | ||||||
| Flood Flow Frequency View a plot of Flood Frequncy Data ***NOTE: Flood Flow Frequency data are for information only and should not be considered valid for regulation*** Magnitude and Probability of Instantaneous Peak Flow | Discharge, in cfs, for indicated Recurrence Interval |
|||||||
| USGS StreamStats Flood Flow Frequency | |||||||
| 2-year | 5-year | 10-year | 25-year | 50-year | 100-year | 200-year | 500-year |