Page Last Updated: 04 November 2025
|
|
Page Last Updated: 04 November 2025 |
| ID | Elevation of Instrument in Gage Height |
Elevation of Instrument in Datum |
Period |
| 74207 | 0.07 feet | 1,961.85 feet NAVD88 | 04/30/2024 -- Current |
| 74207 | 0.90 feet | 1,962.68 feet NAVD88 | 04/28/2020 -- 04/30/2024 |
| 5678 | 0.90 feet | 1,962.68 feet NAVD88 | 10/01/2017 -- 04/28/2020 |
| 5678 | 0.98 feet | 1,962.977 feet NAVD88 | 04/11/2012 -- 09/30/2017 |
| STATUS | Active |
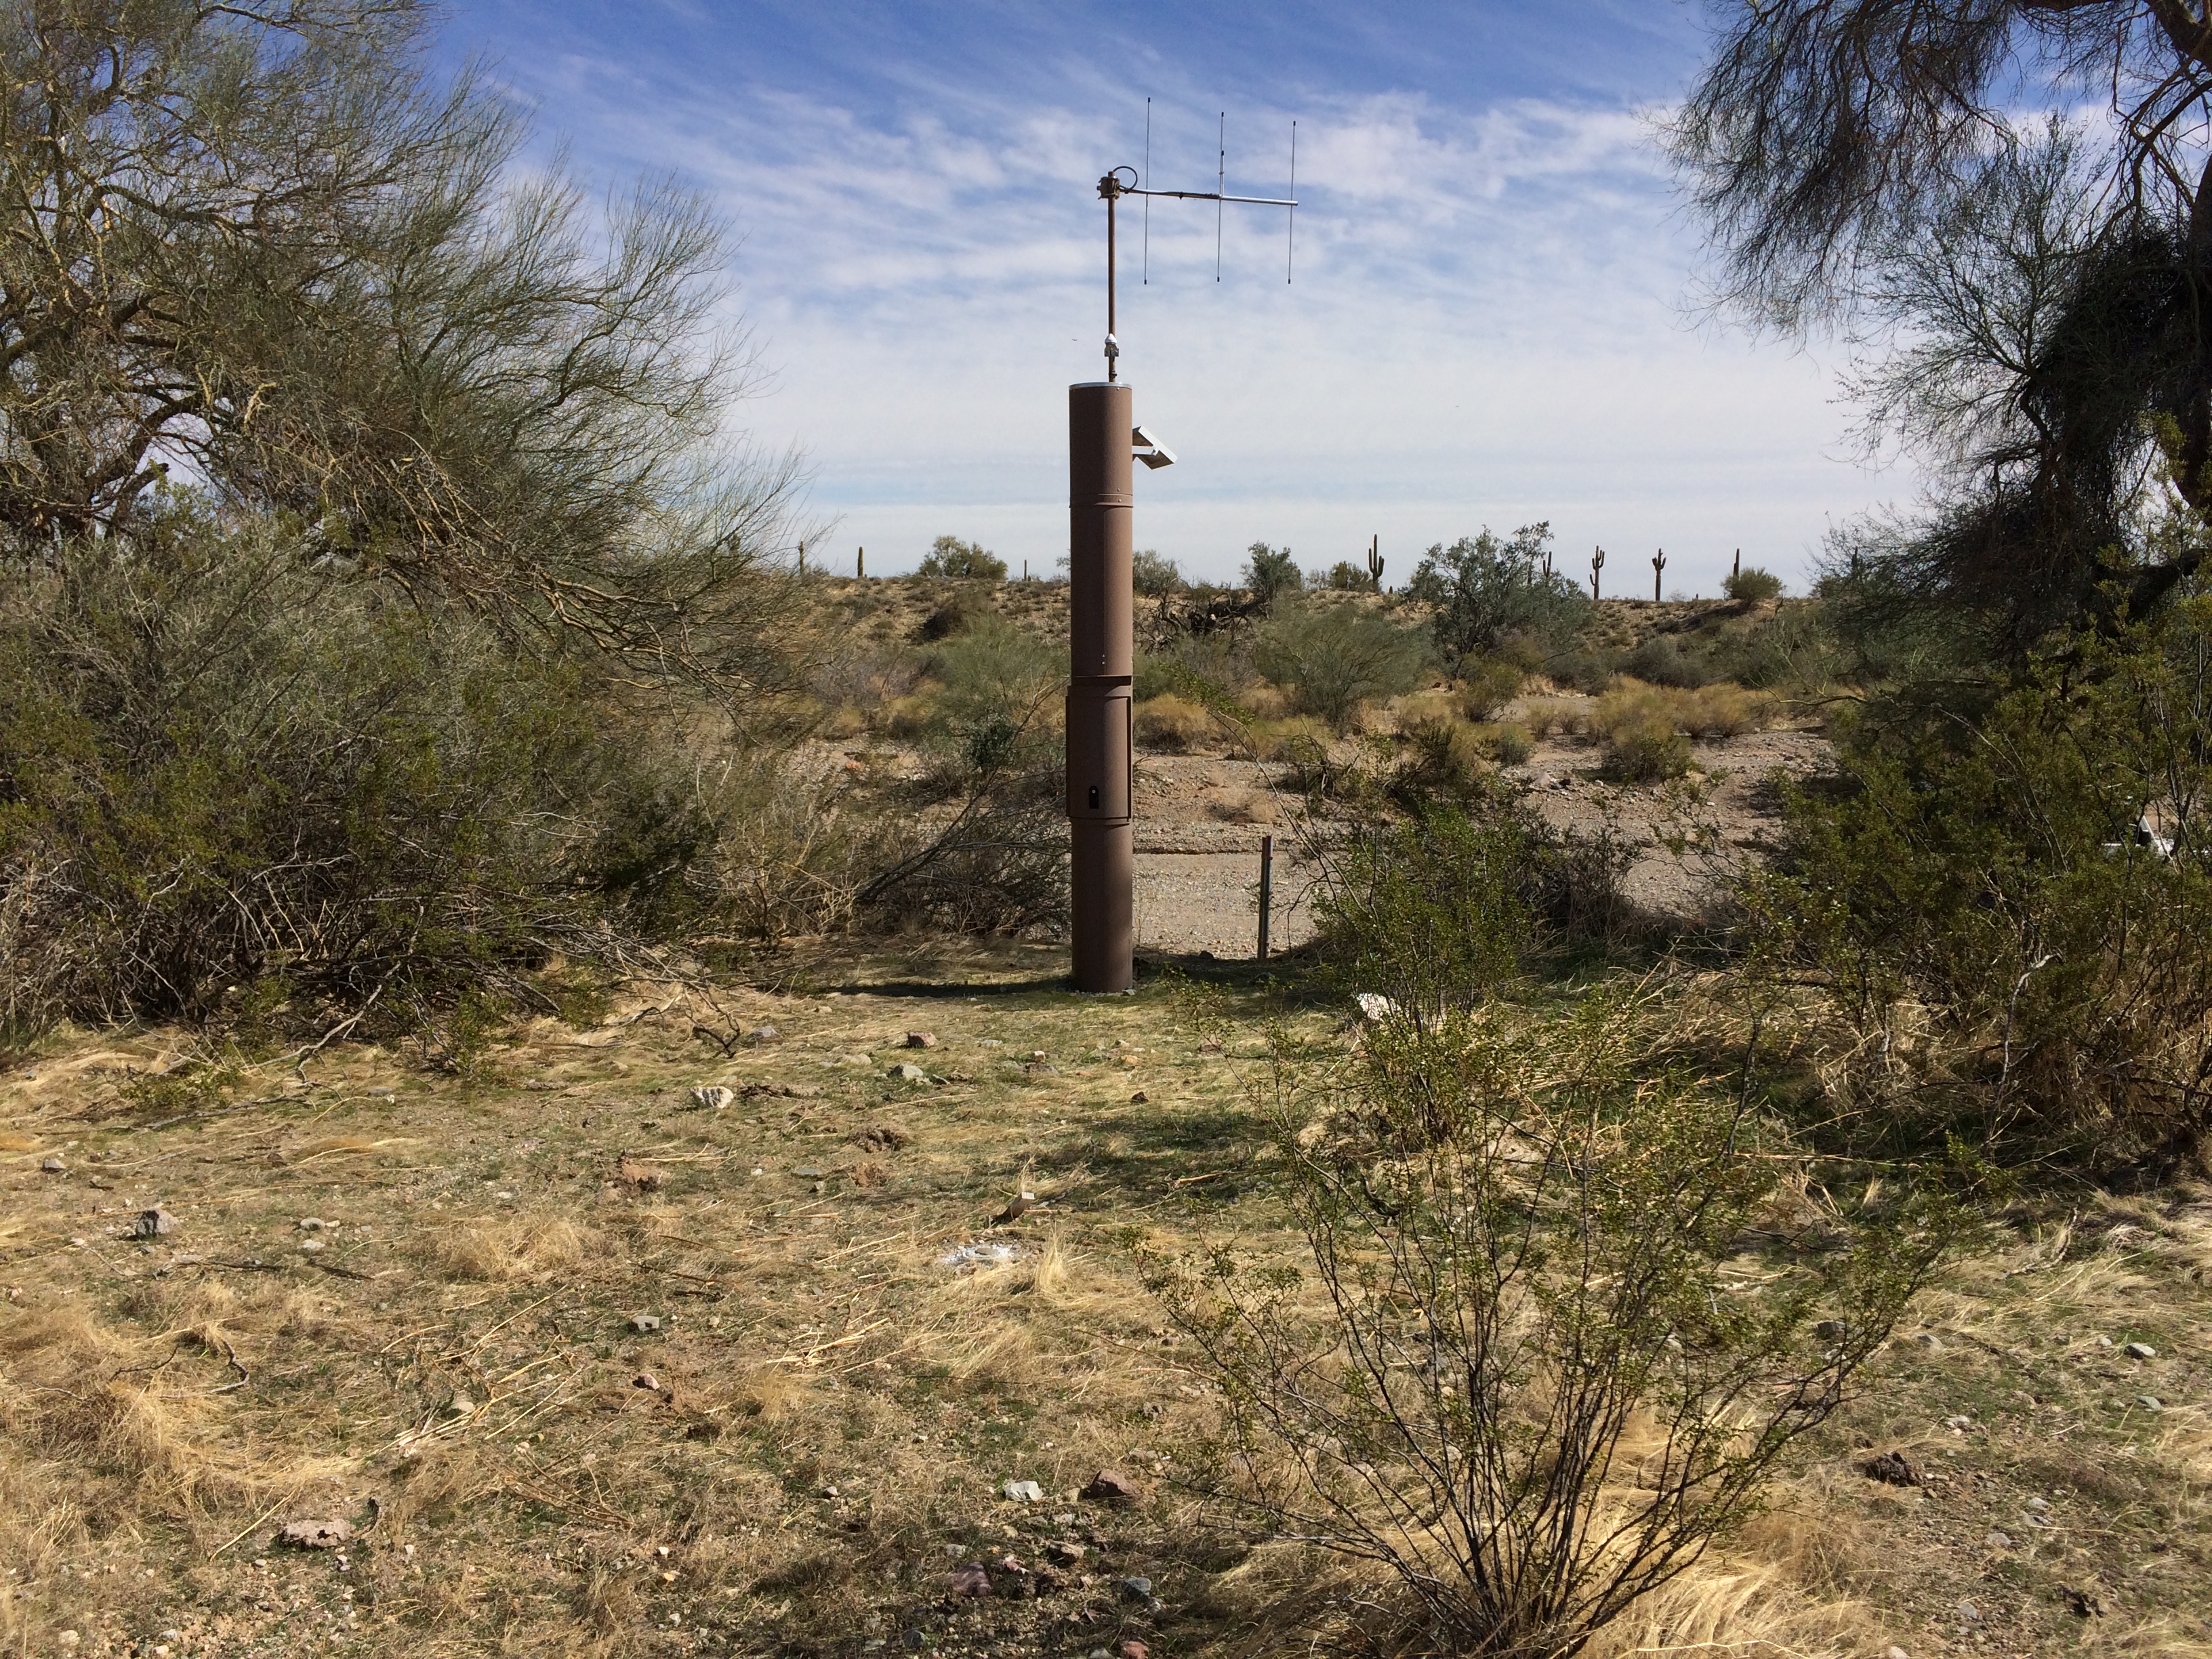
| LOCATION | Located near milepost 10 on SR74 |
| DRAINAGE AREA | 17.8 mi2 |
| STREAM TYPE | Natural Stream |
| JURISDICTION | Maricopa County, Arizona |
| WATERSHED | Trilby |
| SECTION/TOWNSHIP/RANGE | S28 T6N R2W |
| LATITUDE | N 33° 50' 08.3" | +33.83563 |
| LONGITUDE | W 112° 28' 32.1" | -112.47557 |
| ARIZONA STATE PLANE | E 530364 | N 1032224 |
| USGS QUAD SHEET | Hieroglyphic Mountains SW 7.5-Minute |
| STREAMGAGE INSTALLATION DATE | 04/11/2012 - WY 2012 |
| PERIOD OF AVAILABLE DATA RECORD | 04/11/2012 - Current |
| LENGTH OF AVAILABLE DATA RECORD (AS OF 10/01/2024) | 12.47 Years | 4,556 Days |
| GAPS (> 2 DAYS) IN RECORD | None |
| STAGE GAGE TYPE | Pressure Transducer |
| STAGE GAGE ELEVATION | 0.90 feet Gage Height |
| STAFF GAGES | 0 |
| CREST STAGE GAGES | 1 |
| ZERO GAGE HEIGHT ELEVATION | 1,961.783 feet NAVD88 |
| POINT OF ZERO FLOW | -0.1 feet |
| EXTREME FOR PERIOD OF RECORD | 6,167 cfs | 4.41 feet | 09/23/2019 |
| Current Rating = #2 - Applied since 04/15/2024 | ||
| Discharge (cfs) |
Elevation feet Gage Height |
Elevation feet NAVD88 |
| 0 | 0.00 | 1,961.78 |
| 100 | 0.69 | 1962.47 |
| 500 | 1.17 | 1,962.95 |
| 1,000 | 1.61 | 1,963.39 |
| 1,500 | 1.97 | 1,963.75 |
| 2,000 | 2.29 | 1,964.07 |
| 3,000 | 2.84 | 1,964.62 |
| 4,000 | 3.30 | 1,965.08 |
| 5,000 | 3.72 | 1,965.50 |
| 6,000 | 4.06 | 1,965.84 |
| Water Year |
Peak Gage Height (feet) |
Peak Discharge (cfs) |
Date of Peak |
| 2026 | |||
| 2025 | None | 0 | None |
| 2024 | None | 0 | None |
| 2023 | 1.65 | 1,056 | 12/28/2022 |
| 2022 | 1.93 | 2,024 | 08/12/2022 |
| 2021 | None | 0 | None |
| 2020 | None | 0 | None |
| 2019 | 4.41 | 6,167 | 09/23/2019 |
| 2018 | 4.07 | 2,012 | 07/11/2018 |
| 2017 | 2.73 | 746 | 01/01/2017 |
| 2016 | 1.30 | 118 | 08/03/2016 |
| 2015 | 1.46 | 147 | 08/20/2015 |
| 2014 | 1.33 | 124 | 09/08/2014 |
| 2013 | None | 0 | None |
| 2012 (partial) | 3.53 | 1,429 | 08/16/2012 |
| Date of Peak |
Time of Peak |
Runoff Start |
Runoff End |
Duration (hours) |
Peak Stage (feet GH) |
Peak Discharge (CFS) |
Water Year |
| View a Plot of These Data | |||||||
| 12/28/2022 | 08:02 | 12/27/2022 16:02 | 12/28/2022 08:48 | 16.8 | 1.65 | 1,056 | 2023 |
| 08/12/2022 | 17:48 | 08/12/2022 17:46 | 08/12/2022 18:09 | 0.4 | 1.93 | 2,024 | 2022 |
| 09/23/2019 | 14:04 | 09/23/2019 13:50 | 09/23/2019 14:27 | 0.6 | 2.69 | 3,433 | 2019 |
| 09/23/2019 | 12:18 | 09/23/2019 11:58 | 09/23/2019 12:55 | 1.0 | 4.41 | 6,167 | 2019 |
| 08/17/2018 | 14:46 | 08/17/2018 14:42 | 08/17/2018 15:06 | 0.4 | 2.10 | 395 | 2018 |
| 07/11/2018 | 20:44 | 07/11/2018 20:40 | 07/11/2018 21:17 | 0.6 | 4.07 | 2,021 | 2018 |
| 01/01/2017 | 06:14 | 01/01/2017 05:10 | 01/01/2017 08:02 | 2.9 | 2.73 | 746 | 2017 |
| 08/03/2016 | 15:08 | 08/03/2016 15:08 | 08/03/2016 15:54 | 0.8 | 1.30 | 18 | 2016 |
| 10/20/2015 | 09:49 | 10/20/2015 09:47 | 10/20/2015 10:01 | 0.2 | 1.18 | 55 | 2016 |
| 09/07/2015 | 19:03 | 09/07/2015 19:03 | 09/07/2015 19:39 | 0.6 | 1.23 | 107 | 2015 |
| 08/20/2015 | 20:30 | 08/20/2015 20:30 | 08/20/2015 01:03 | 4.6 | 1.46 | 147 | 2015 |
| 07/18/2015 | 18:51 | 07/18/2015 18:51 | 07/18/2015 19:58 | 1.1 | 1.33 | 124 | 2015 |
| 09/08/2014 | 08:38 | 09/08/2014 08:05 | 09/08/2014 11:14 | 3.2 | 1.33 | 124 | 2014 |
| 09/08/2014 | 03:38 | 09/08/2014 03:38 | 09/08/2014 05:10 | 1.5 | 1.20 | 102 | 2014 |
| 08/19/2014 | 16:51 | 08/19/2014 16:39 | 08/19/2014 16:59 | 0.3 | 1.20 | 102 | 2014 |
| 08/12/2014 | 21:29 | 08/12/2014 21:29 | 08/12/2014 21:46 | 0.3 | 1.30 | 119 | 2014 |
| 08/23/2012 | 02:41 | 08/23/2012 02:41 | 08/23/2012 03:25 | 0.7 | 2.78 | 779 | 2012 |
| 08/16/2012 | 21:40 | 08/16/2012 20:59 | 08/16/2012 22:31 | 1.5 | 3.53 | 1,429 | 2012 |
| 07/14/2012 | 17:15 | 07/14/2012 16:49 | 07/14/2012 20:44 | 3.9 | 2.60 | 667 | 2012 |
| Flood Flow Frequency View a plot of Flood Frequncy Data ***NOTE: Flood Flow Frequency data are for information only and should not be considered valid for regulation*** Magnitude and Probability of Instantaneous Peak Flow | Discharge, in cfs, for indicated Recurrence Interval |
|||||||
| USGS StreamStats Flood Flow Frequency | |||||||
| 2-year | 5-year | 10-year | 25-year | 50-year | 100-year | 200-year | 500-year |
| Crest Gage Number | Pin Elevation (Feet, Gage Height) |
Additional Information |
| 1 | 0.93 | Located on right bank near transducer |