
Page Last Updated: 23 October 2024
|
|
Page Last Updated: 23 October 2024 |
| ID | Elevation of Instrument in Gage Height |
Elevation of Instrument in Datum |
Period |
| 64007 | 0.00 feet | 1,295.416 feet NAVD88 | 04/22/2020 -- Current |
| 793 | 0.00 feet | 1,295.416 feet NAVD88 | 10/01/1996 -- 04/22/2020 |
| 793 | 0.10 feet | 0.10 feet Gage Height | 10/01/1996 -- 09/30/2015 |
| 793 | 1.20 feet | 1.20 feet Gage Height | 03/23/1994 -- 09/30/1996 |
| STATUS | Active |
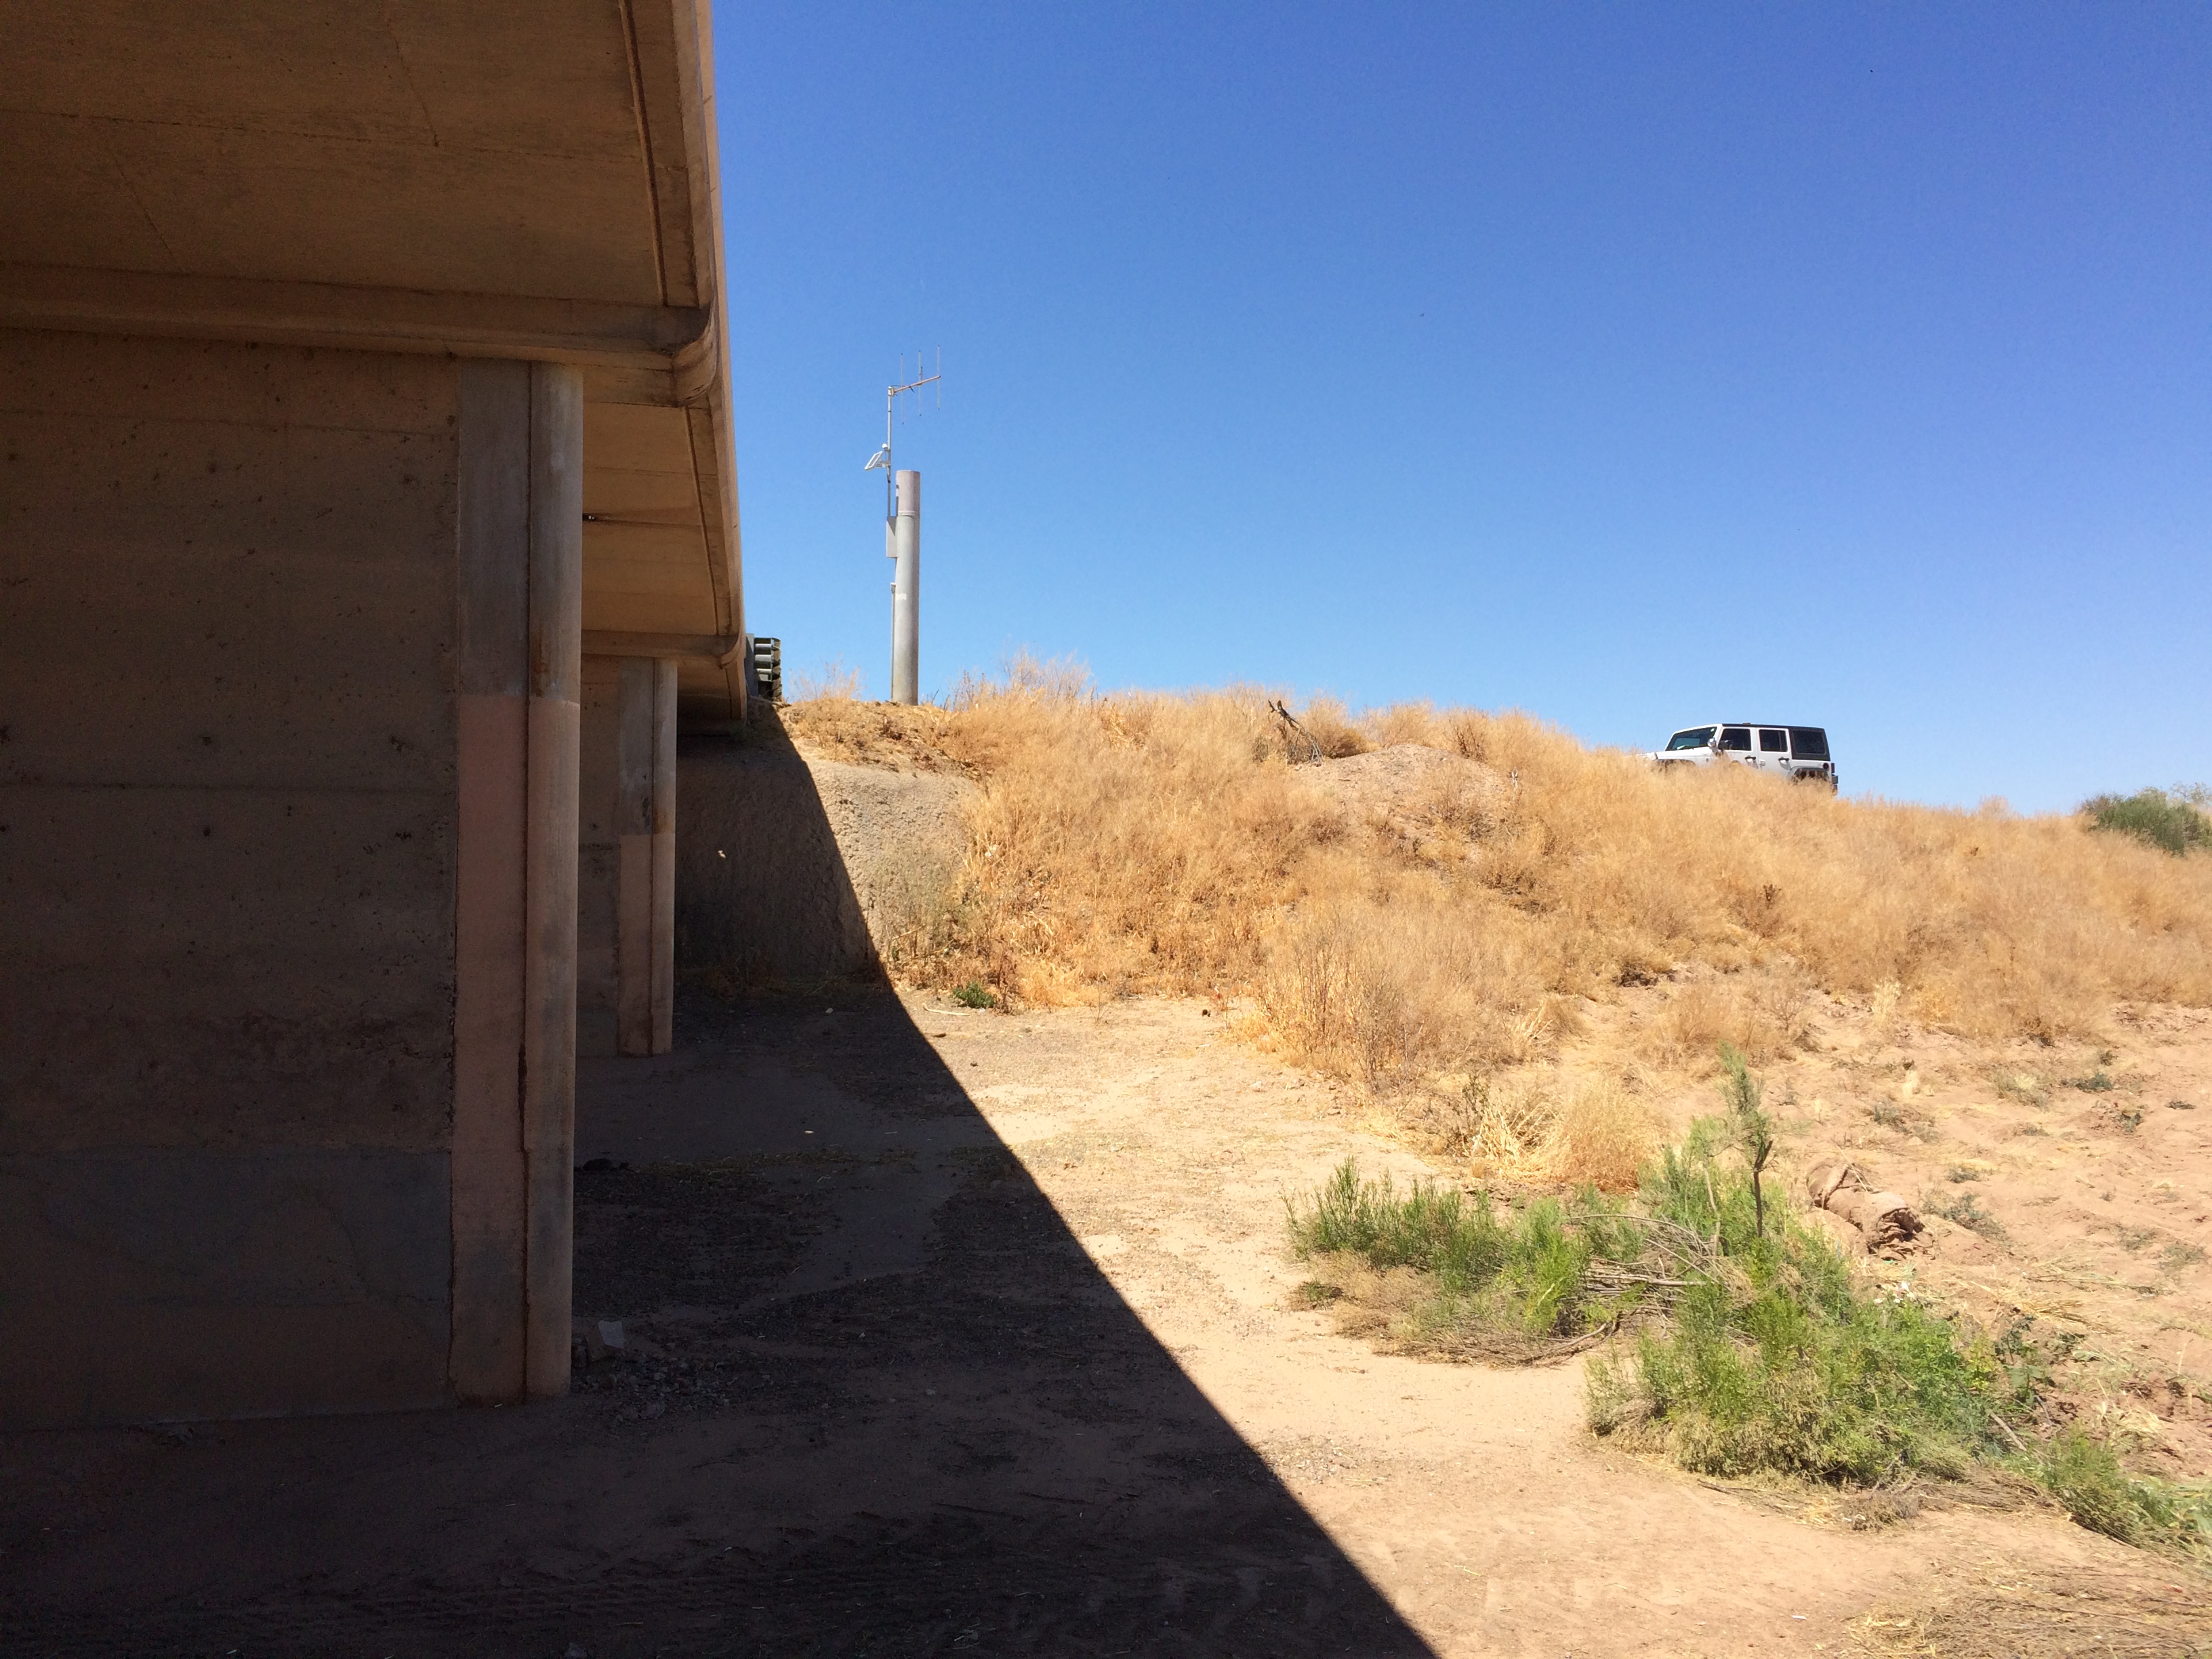
| LOCATION | On SR 84 between Stanfield and Casa Grande |
| DRAINAGE AREA | ~1,729 mi2 |
| STREAM TYPE | Channelized Natural Stream |
| JURISDICTION | Pinal County, Arizona |
| WATERSHED | Santa Rosa |
| SECTION/TOWNSHIP/RANGE | S21 T6S R4E |
| LATITUDE | N 32° 52' 46.1" | +32.87948 |
| LONGITUDE | W 111° 56' 01.3" | -111.93369 |
| ARIZONA STATE PLANE | E 694764 | N 683676 |
| USGS QUAD SHEET | Stanfield 7.5-Minute |
| STREAMGAGE INSTALLATION DATE | 03/23/1994 - WY 1994 |
| PERIOD OF AVAILABLE DATA RECORD | 03/23/1994 - Current |
| LENGTH OF AVAILABLE DATA RECORD (AS OF 10/01/2024) | 30.53 Years | 11,150 Days |
| GAPS (> 2 DAYS) IN RECORD | None |
| STAGE GAGE TYPE | Pressure Transducer |
| STAGE GAGE ELEVATION | 0.10 feet Gage Height |
| STAFF GAGES | 1 |
| CREST STAGE GAGES | 2 |
| ZERO GAGE HEIGHT ELEVATION | 1,295.416 feet NAVD88 |
| POINT OF ZERO FLOW | -3.8 feet Gage Height |
| EXTREME FOR PERIOD OF RECORD | 1,391 cfs | 3.67 feet | 08/02/2006 |
| Current Rating = #4 - Applied since 10/01/2019 | ||
| Discharge (cfs) |
Elevation feet Gage Height |
Elevation feet NAVD88 |
| 0 | -3.80 | 1,291.61 |
| 100 | -0.52 | 1,294.89 |
| 156 | 0.00 | 1,295.41 |
| 200 | 0.33 | 1,295.74 |
| 500 | 1.49 | 1,296.90 |
| 1,000 | 2.81 | 1,298.22 |
| 1,500 | 3.83 | 1,299.24 |
| 2,000 | 4.71 | 1,300.12 |
| 5,000 | 8.51 | 1,303.92 |
| Water Year |
Peak Gage Height (feet) |
Peak Discharge (cfs) |
Date of Peak |
| 2025 | |||
| 2024 | 0.37 | 63 | 08/22/2024 |
| 2023 | 0.22 | 184 | 09/01/2023 |
| 2022 | None | 0 | None |
| 2021 | 0.67 | 269 | 07/27/2021 |
| 2020 | None | 0 | None |
| 2019 | None | 0 | None |
| 2018 | None | 0 | None |
| 2017 | None | 0 | None |
| 2016 | None | 0 | None |
| 2015 | None | 0 | None |
| 2014 | 0.32 | 54 | 09/10/2014 |
| 2013 | None | 0 | None |
| 2012 | None | 0 | None |
| 2011 | None | 0 | None |
| 2010 | 0.40 | 65 | 07/29/2010 |
| 2009 | None | 0 | None |
| 2008 | None | 0 | None |
| 2007 | 0.47 | 74 | 08/04/2007 |
| 2006 | 3.67 | 1,391 | 08/02/2006 |
| 2005 | None | 0 | None |
| 2004 | None | 0 | None |
| 2003 | None | 0 | None |
| 2002 | None | 0 | None |
| 2001 | 3.28 | 1,154 | 10/25/2000 |
| 2000 | None | 0 | None |
| 1999 | None | 0 | None |
| 1998 | 0.82 | 130 | 02/09/1998 |
| 1997 | 1.95 | 482 | 09/06/1997 |
| 1996 | None | 0 | None |
| 1995 | 3.92 | 812 | 02/17/1995 |
| 1994 | None | 0 | None |
| Date of Peak |
Time of Peak |
Runoff Start |
Runoff End |
Duration (hours) |
Peak Stage (feet GH) |
Peak Discharge (CFS) |
Water Year |
| View a Plot of These Data | |||||||
| 12/15/2023 | 03:18 | 12/14/2024 18:00 | 12/15/2024 18:00 | 24.0 | 0.37 | 207 | 2024 |
| 09/01/2023 | 00:15 | 08/31/2023 18:00 | 09/01/2023 06:00 | 12.0 | 0.22 | 184 | 2023 |
| 08/19/2021 | 03:44 | 08/18/2021 23:10 | 08/19/2021 13:02 | 13.9 | 0.25 | 188 | 2021 |
| 08/17/2021 | 02:20 | 08/17/2021 00:34 | 08/17/2021 07:57 | 7.4 | 0.37 | 207 | 2021 |
| 08/14/2021 | 02:57 | 08/14/2021 02:53 | 08/14/2021 06:00 | 3.1 | 0.40 | 213 | 2021 |
| 07/27/2021 | 05:47 | 07/27/2021 00:52 | 07/28/2021 09:00 | 32.1 | 0.67 | 269 | 2021 |
| 07/25/2021 | 13:01 | 07/25/2021 11:17 | 07/25/2021 13:20 | 2.1 | 0.17 | 177 | 2021 |
| 09/10/2014 | 18:11 | 09/10/2014 15:49 | 09/11/2014 03:30 | 11.7 | 0.32 | 54 | 2014 |
| 07/29/2010 | 17:48 | 07/29/2010 17:36 | 07/29/2010 18:39 | 1.1 | 0.40 | 65 | 2010 |
| 01/22/2010 | 15:09 | 01/22/2010 15:09 | single report | 0.0 | 0.20 | 15 | 2010 |
| 08/08/2007 | 10:31 | 08/08/2007 07:43 | 08/08/2007 16:46 | 9.1 | 0.47 | 74 | 2007 |
| 08/04/2007 | 03:58 | 08/04/2007 00:33 | 08/04/2007 20:01 | 19.5 | 0.47 | 74 | 2007 |
| 08/11/2006 | 00:57 | 08/10/2006 23:42 | 08/11/2006 06:20 | 6.6 | 0.32 | 54 | 2006 |
| 08/02/2006 | 03:49 | 07/31/2006 15:51 | 08/03/2006 19:46 | 75.9 | 3.67 | 1,391 | 2006 |
| 11/08/2000 | 21:57 | 11/08/2000 15:43 | 11/10/2000 10:36 | 42.9 | 1.77 | 419 | 2001 |
| 10/28/2000 | 00:52 | 10/27/2000 22:36 | 10/28/2000 05:04 | 6.5 | 0.52 | 80 | 2001 |
| 10/25/2000 | 08:46 | 10/24/2000 23:20 | 10/26/2000 22:36 | 47.3 | 3.28 | 1,154 | 2001 |
| 02/20/1998 | 17:55 | 02/20/1998 12:23 | 02/20/1998 23:15 | 10.9 | 0.30 | 50 | 1998 |
| 02/09/1998 | 09:29 | 02/09/1998 05:38 | 02/09/1998 15:01 | 9.4 | 0.82 | 130 | 1998 |
| 09/06/1997 | 00:38 | 09/06/1997 00:13 | 09/06/1997 07:14 | 7.0 | 1.95 | 482 | 1997 |
| 02/16/1995 | 14:39 | 02/15/1995 23:59 | 02/19/1995 21:04 | 93.1 | 3.92 | 812 | 1995 |
| 01/07/1995 | 06:11 | 01/06/1995 20:01 | 01/09/1995 06:47 | 58.8 | 3.48 | 615 | 1995 |
| 12/08/1994 | 15:41 | 12/08/1994 07:13 | 12/09/1994 06:46 | 23.6 | 2.53 | 292 | 1995 |
| Flood Flow Frequency View a plot of Flood Frequncy Data ***NOTE: Flood Flow Frequency data are for information only and should not be considered valid for regulation*** Magnitude and Probability of Instantaneous Peak Flow | Discharge, in cfs, for indicated Recurrence Interval |
|||||||
| USGS StreamStats Flood Flow Frequency | |||||||
| 2-year | 5-year | 10-year | 25-year | 50-year | 100-year | 200-year | 500-year |
| Staff Gage Range | Staff Gage Information |
| 0 - 7 | On pier with transducer, reads in gage height |
| Crest Gage Number | Pin Elevation (Feet, Gage Height) |
Additional Information |
| 1 | 0.49 | Located on the pier with the level sensor |
| 2 | 4.42 | Located on the pier with the level sensor |