
Page Last Updated: 23 October 2024
|
|
Page Last Updated: 23 October 2024 |
| ID | Elevation of Instrument in Gage Height |
Elevation of Instrument in Datum |
Period |
| 62107 | 0.80 feet | 1,533.80 feet NAVD88 | 10/17/2019 -- Current |
| STATUS | Active |
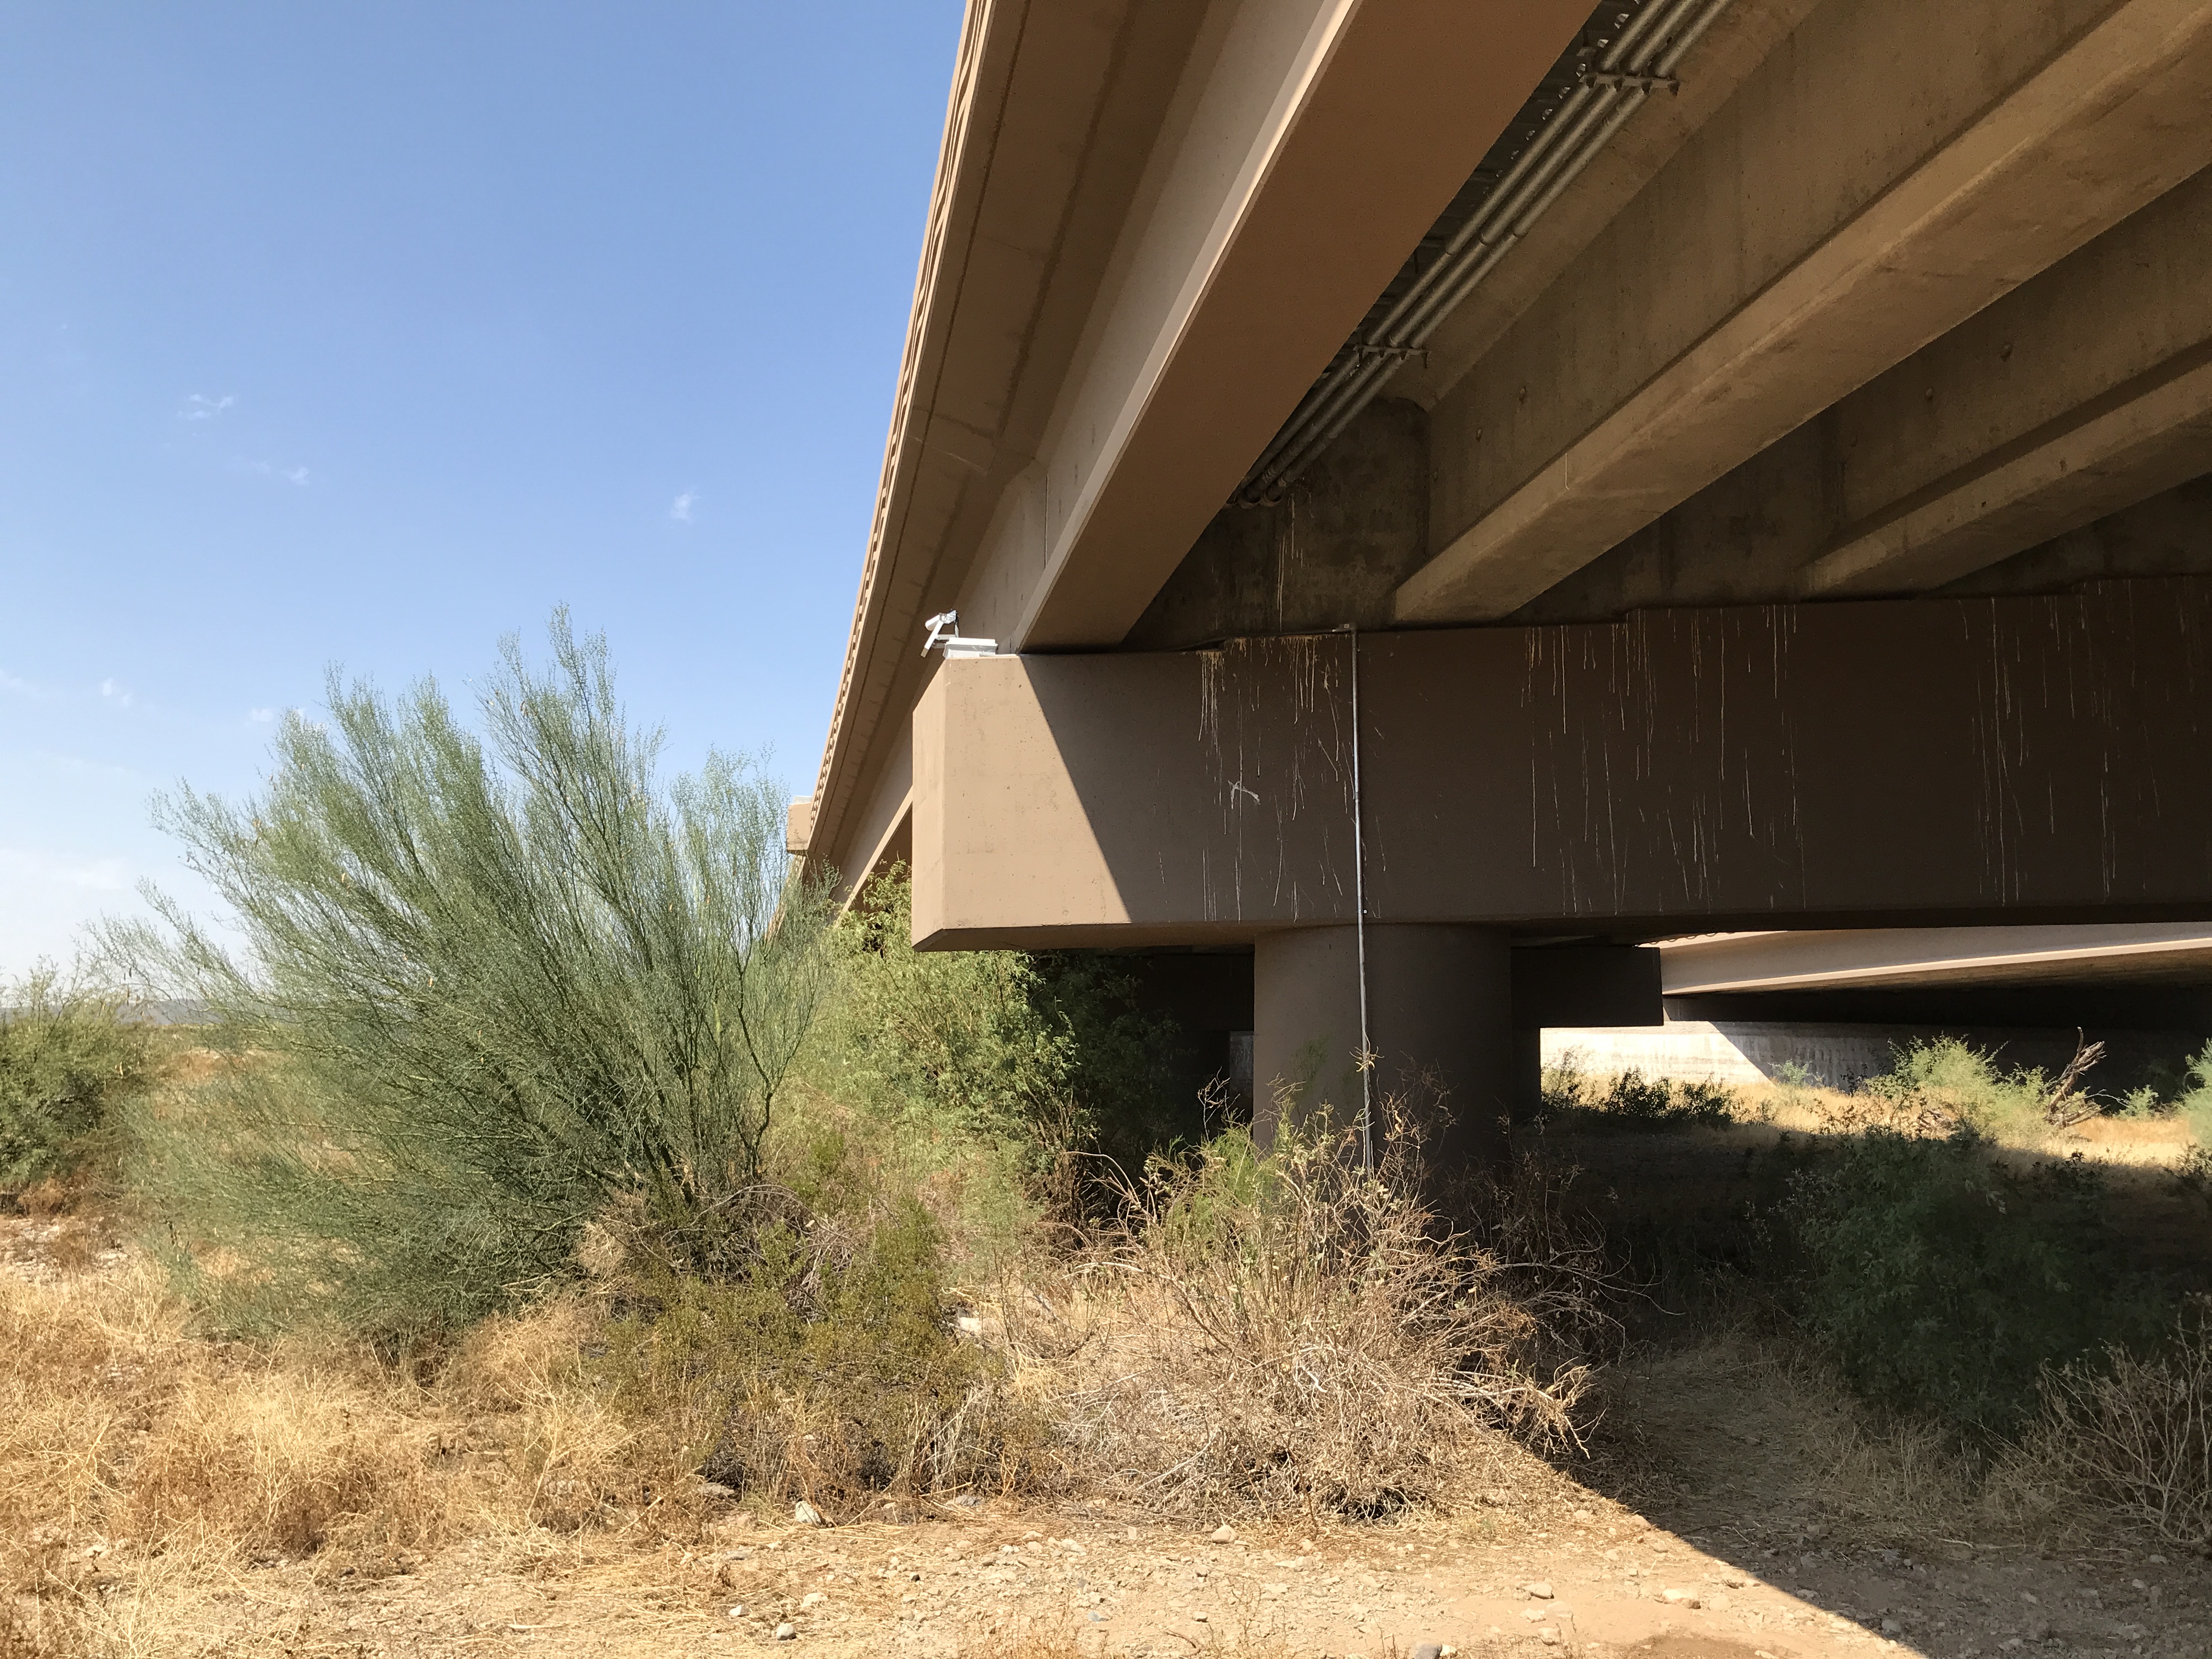
| LOCATION | On the eastbound Loop 303 bridge |
| DRAINAGE AREA | 20.1 mi2 |
| STREAM TYPE | Natural Stream |
| JURISDICTION | Phoenix, Arizona |
| WATERSHED | Upper New River |
| SECTION/TOWNSHIP/RANGE | S18 T5N R2E |
| LATITUDE | N 33° 46' 52.4" | +33.78128 |
| LONGITUDE | W 112° 11' 38.1" | -112.19388 |
| ARIZONA STATE PLANE | E 615767 | N 1011915 |
| USGS QUAD SHEET | Biscuit Flat 7.5-Minute |
| STREAMGAGE INSTALLATION DATE | 10/17/2019 - WY 2020 |
| PERIOD OF AVAILABLE DATA RECORD | 10/17/2019 - Current |
| LENGTH OF AVAILABLE DATA RECORD (AS OF 10/01/2024) | 4.96 Years | 1,811 Days |
| GAPS (> 2 DAYS) IN RECORD | None |
| STAGE GAGE TYPE | Pressure Transducer |
| STAGE GAGE ELEVATION | 0.80 feet Gage Height |
| STAFF GAGES | 0 |
| CREST STAGE GAGES | 1 |
| ZERO GAGE HEIGHT ELEVATION | 1,533.000 feet NAVD88 |
| POINT OF ZERO FLOW | 0.0 feet Gage Height |
| EXTREME FOR PERIOD OF RECORD | 3,607 cfs | 3.28 feet Gage Height | 09/01/2023 |
| EXTREME OUTSIDE PERIOD OF RECORD | None Known |
| Current Rating = #2 - Applied since 11/21/2024 | ||
| Discharge (cfs) |
Elevation Feet, Gage Height |
Elevation Feet, NAVD88 |
| 0 | 0.00 | 1,533.00 |
| 100 | 0.35 | 1,533.35 |
| 500 | 1.18 | 1,534.18 |
| 700 | 1.41 | 1,534.41 |
| 1,000 | 1.64 | 1,534.64 |
| 1,500 | 2.04 | 1,535.04 |
| 2,000 | 2.49 | 1,535.49 |
| 2,500 | 2.82 | 1,535.82 |
| 4,000 | 3.40 | 1,536.40 |
| 6,000 | 4.08 | 1,537.08 |
| 10,000 | 5.11 | 1,538.11 |
| Water Year |
Peak Gage Height (feet) |
Peak Discharge (cfs) |
Date of Peak |
| 2025 | |||
| 2024 | None | 0 | None |
| 2023 | 3.28 | 3,607 | 09/01/2023 |
| 2022 | None | 0 | None |
| 2021 | 1.75 | 749 | 08/12/2021 |
| 2020 | 1.42 | 417 | 11/20/2019 |
| Date of Peak |
Time of Peak |
Runoff Start |
Runoff End |
Duration (hours) |
Peak Stage (feet GH) |
Peak Discharge (CFS) |
Water Year |
| View a Plot of These Data | |||||||
| 09/01/2023 | 02:31 | 09/01/2023 00:00 | 09/01/2023 06:47 | 6.8 | 3.28 | 3,607 | 2023 |
| 08/13/2021 | 23:14 | 08/13/2021 23:07 | 08/14/2021 06:00 | 6.9 | 1.44 | 435 | 2021 |
| 08/12/2021 | 10:34 | 08/12/2021 10:29 | 08/12/2021 13:52 | 3.4 | 1.75 | 749 | 2021 |
| 03/13/2020 | 21:55 | 03/13/2020 21:55 | 03/14/2020 00:40 | 2.8 | 0.92 | 123 | 2020 |
| 03/13/2020 | 06:00 | 03/13/2020 04:51 | 03/13/2020 09:15 | 4.4 | 1.19 | 250 | 2020 |
| 11/20/2019 | 18:00 | 11/20/2019 18:00 | 11/21/2019 06:00 | 12.0 | 1.42 | 417 | 2020 |
| Flood Flow Frequency View a plot of Flood Frequncy Data ***NOTE: Flood Flow Frequency data are for information only and should not be considered valid for regulation*** Magnitude and Probability of Instantaneous Peak Flow | Discharge, in cfs, for indicated Recurrence Interval |
|||||||
| USGS StreamStats Flood Flow Frequency | |||||||
| 2-year | 5-year | 10-year | 25-year | 50-year | 100-year | 200-year | 500-year |
| Crest Gage Number | Pin Elevation (Feet, Gage Height) |
Additional Information |
| 1 | 0.33 | Located on pier with transducer |