
Page Last Updated: 24 October 2024
|
|
Page Last Updated: 24 October 2024 |
| ID | Elevation of Instrument in Gage Height |
Elevation of Instrument in Datum |
Period |
| 44707 | 0.05 feet gage height | 1,434.850 feet NAVD88 | 02/16/2017 -- Current |
| STATUS | Active Alert2 Station |
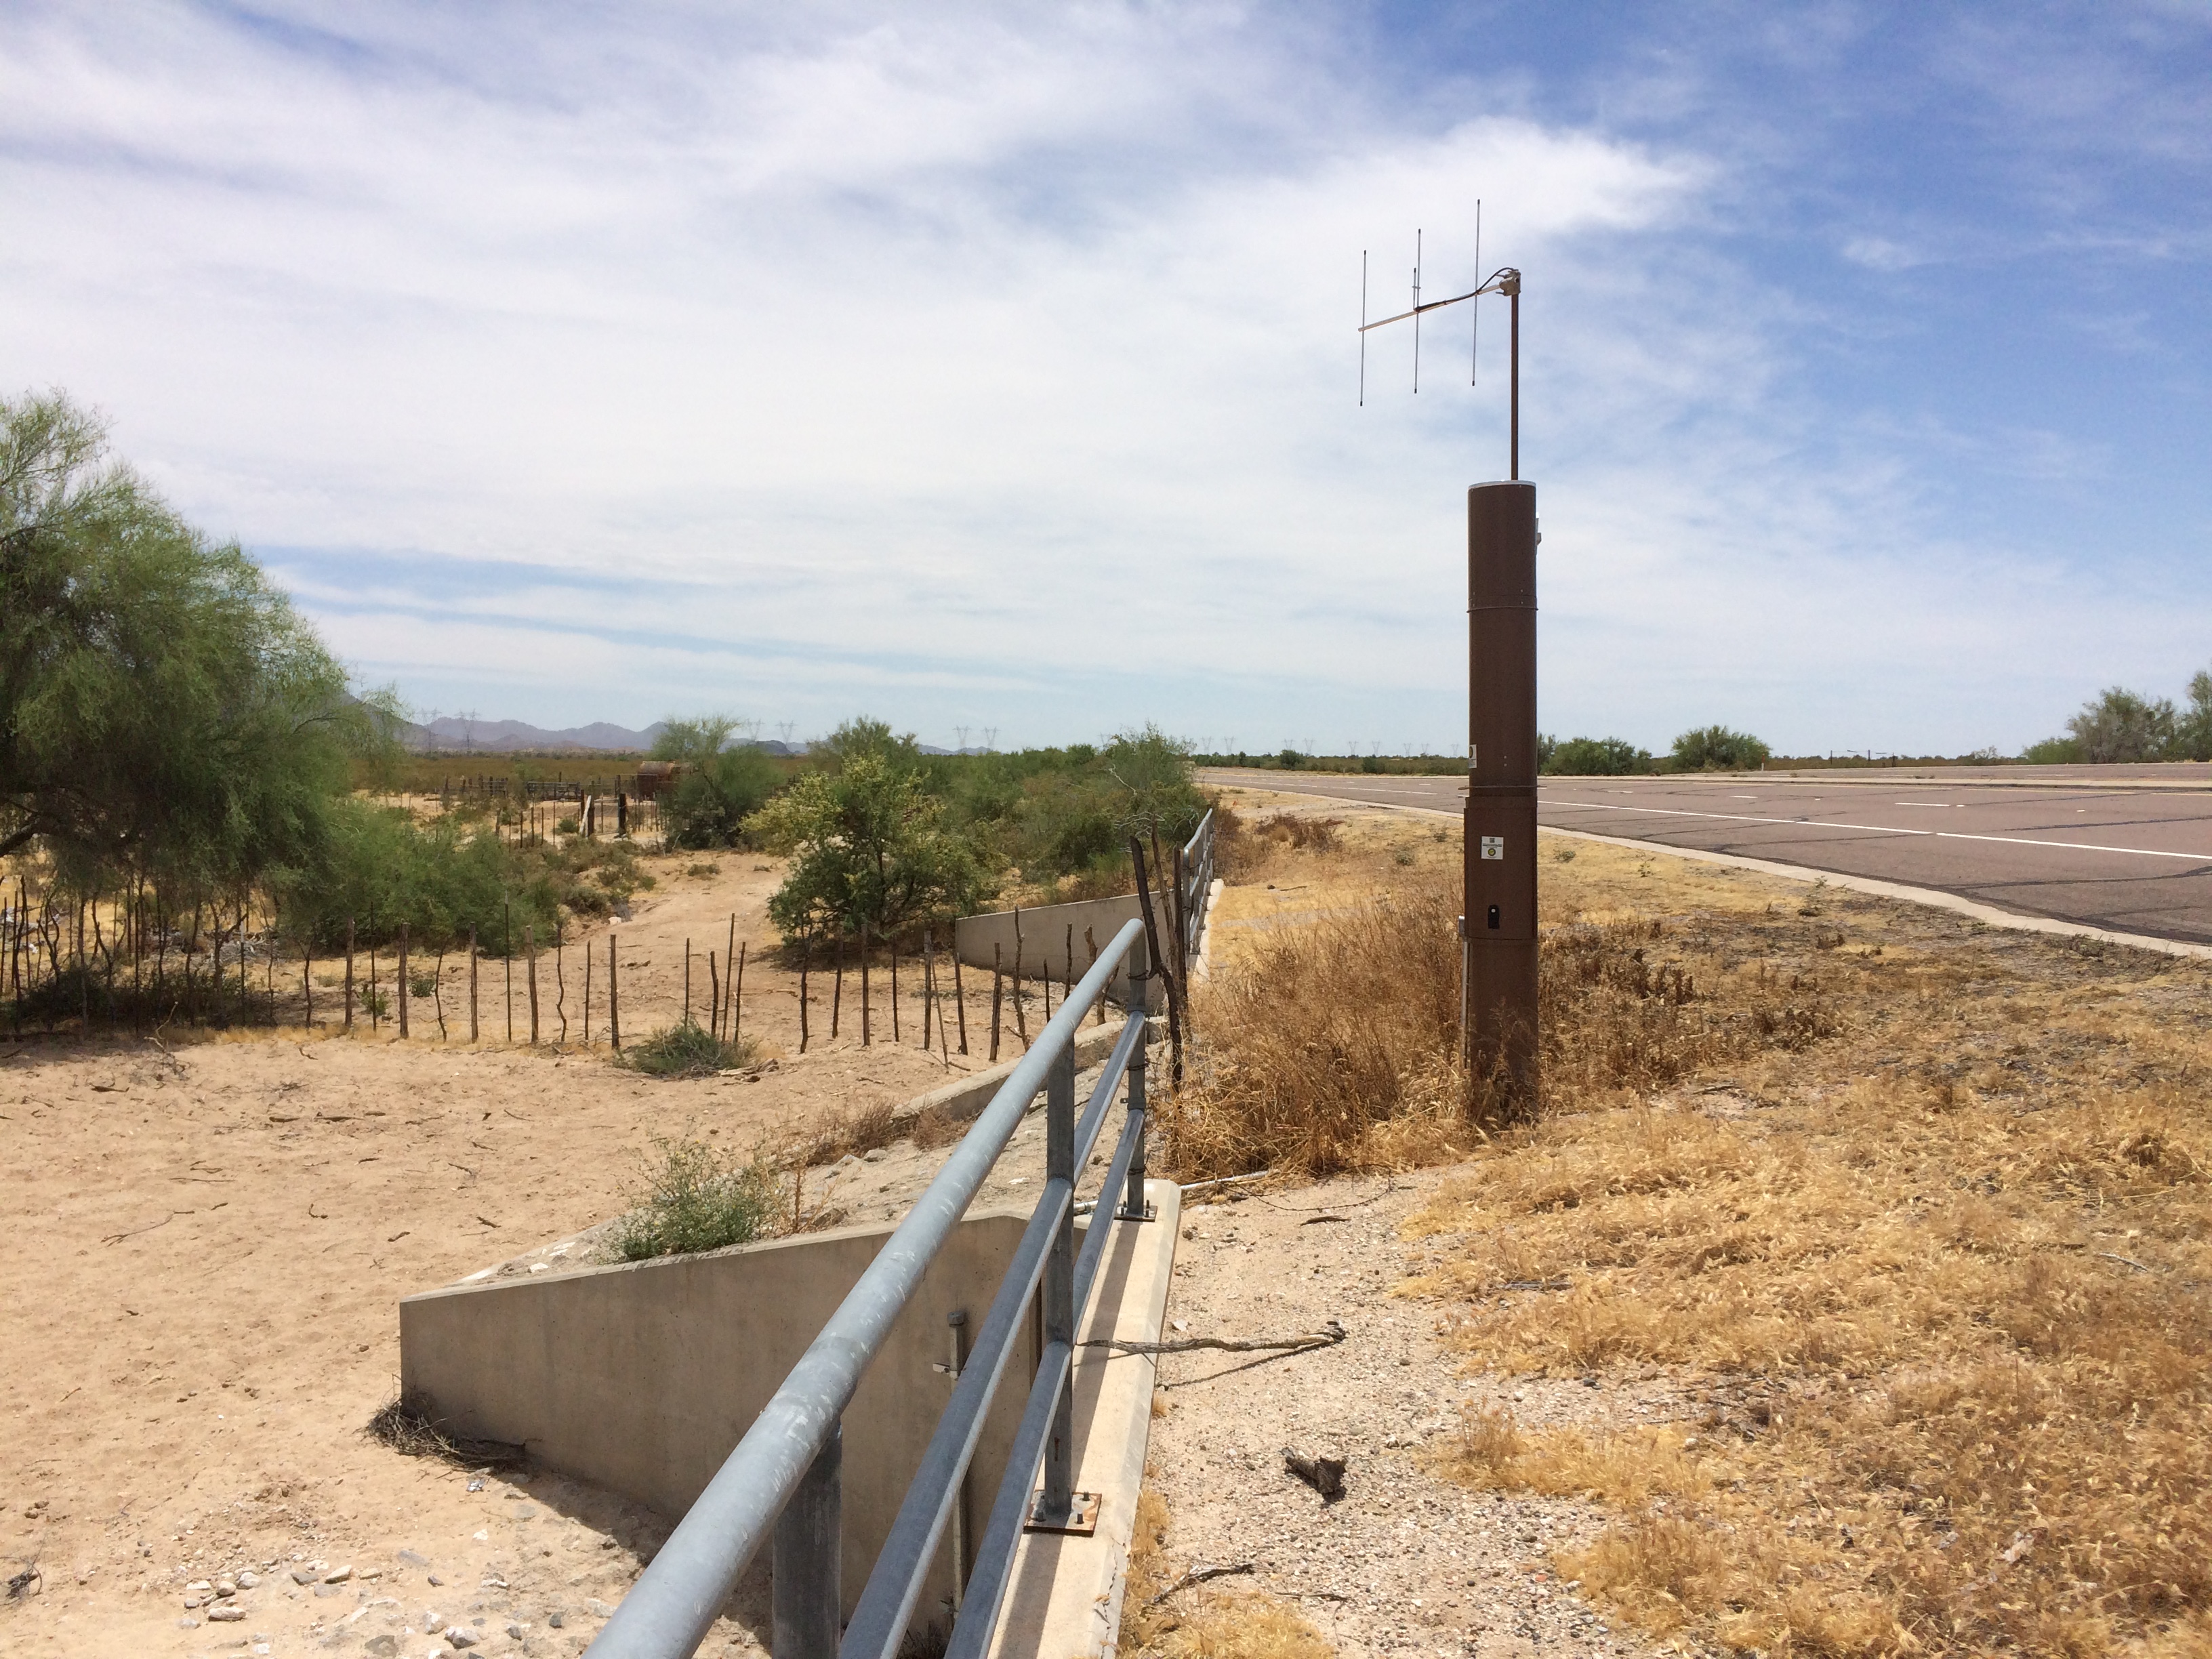
| LOCATION | Located on Sun Valley Parkway at about Bell Road alignment |
| DRAINAGE AREA | 27.7 mi2 via USGS Streamstats |
| STREAM TYPE | Natural wash flows at a culvert |
| JURISDICTION | Buckeye, Arizona |
| WATERSHED | Lower Hassayampa |
| SECTION/TOWNSHIP/RANGE | S05 T3N R4W |
| LATITUDE | N 33° 38' 07.0" | +33.6357 |
| LONGITUDE | W 112° 41' 26.0" | -112.6906 |
| ARIZONA STATE PLANE | E 464460 | N 959550 |
| USGS QUAD SHEET | Daggs Tank 7.5-Minute |
| STREAMGAGE INSTALLATION DATE | 02/16/2017 - WY 2017 |
| PERIOD OF AVAILABLE DATA RECORD | 02/16/2017 - Current |
| LENGTH OF AVAILABLE DATA RECORD (AS OF 10/01/2024) | 7.62 Years | 2,784 Days |
| GAPS (> 2 DAYS) IN RECORD | None |
| STAGE GAGE TYPE | Pressure Transducer |
| STAGE GAGE ELEVATION | 0.05 feet Gage Height |
| STAFF GAGES | None |
| CREST STAGE GAGES | 1 |
| ZERO GAGE HEIGHT ELEVATION | 1,434.800 feet NAVD88 |
| POINT OF ZERO FLOW | 0.0 feet Gage Height |
| EXTREME FOR PERIOD OF RECORD | 1,358 cfs | 2.97 feet GH | 08/16/2018 |
| Current Rating = #1 - Applied since 02/16/2017 | ||
| Discharge (cfs) |
Elevation feet Gage Height |
Elevation feet NAVD88 |
| 0 | 0.00 | 1,434.80 |
| 100 | 1.81 | 1,436.61 |
| 200 | 2.03 | 1,436.83 |
| 500 | 2.36 | 1,437.16 |
| 1,000 | 2.76 | 1,437.56 |
| 1,500 | 3.05 | 1,437.85 |
| 2,000 | 3.33 | 1,438.13 |
| 5,000 | 4.49 | 1,439.29 |
| 10,000 | 6.70 | 1,441.50 |
| 10,358 (100-yr) | 6.91 | 1,441.71 |
| Water Year |
Peak Gage Height (feet) |
Peak Discharge (cfs) |
Date of Peak |
| 2025 | |||
| 2024 | None | 0 | None |
| 2023 | None | 0 | None |
| 2022 | 1.50 | 39 | 09/12/2022 |
| 2021 | 2.70 | 917 | 07/31/2021 |
| 2020 | 0.65 | 2 | 03/13/2020 |
| 2019 | 1.53 | 41 | 09/26/2019 |
| 2018 | 2.97 | 1,358 | 08/16/2018 |
| 2017 (partial) | None | 0 | None |
| Date of Peak |
Time of Peak |
Runoff Start |
Runoff End |
Duration (hours) |
Peak Stage (feet GH) |
Peak Discharge (CFS) |
Water Year |
| View a Plot of These Data | |||||||
| 09/12/2022 | 03:44 | 09/12/2022 02:57 | 09/12/2022 04:24 | 1.5 | 1.50 | 39 | 2022 |
| 08/27/2022 | 14:22 | 08/27/2022 14:04 | 08/27/2022 14:49 | 0.8 | 1.43 | 32 | 2022 |
| 07/31/2021 | 02:04 | 07/31/2021 01:48 | 07/31/2021 03:55 | 2.1 | 2.70 | 917 | 2021 |
| 03/13/2020 | 00:33 | 03/13/2020 00:19 | 03/13/2020 00:37 | 0.3 | 0.65 | 2 | 2020 |
| 09/26/2019 | 06:02 | 09/26/2019 05:50 | 09/26/2019 06:31 | 0.7 | 1.53 | 41 | 2019 |
| 08/16/2018 | 17:07 | 08/16/2018 16:38 | 08/16/2018 19:17 | 2.7 | 2.97 | 1,358 | 2018 |
| Flood Flow Frequency View a plot of Flood Frequncy Data ***NOTE: Flood Flow Frequency data are for information only and should not be considered valid for regulation*** Magnitude and Probability of Instantaneous Peak Flow | Discharge, in cfs, for indicated Recurrence Interval |
|||||||
| FEMA Flood Insurance Study | |||||||
| 2-year | 5-year | 10-year | 20-year | 50-year | 100-year | 200-year | 500-year |
| ----- | ----- | ----- | ----- | ----- | 10,358 | ----- | ----- |
| Crest Gage Number | Pin Elevation (Feet, Gage Height) |
Additional Information |
| 1 | 0.33 | Located just to the left of the transducer |