
Page Last Updated: 04 November 2025
|
|
Page Last Updated: 04 November 2025 |
| ID | Elevation of Instrument in Gage Height |
Elevation of Instrument in Datum |
Period |
| 41707 | 1.36 feet | 1,117.30 feet NAVD88 | 04/10/2020 -- Current |
| 778 | 1.36 feet | 1,117.30 feet NAVD88 | 04/09/1995 -- 04/10/2020 |
| STATUS | Active |
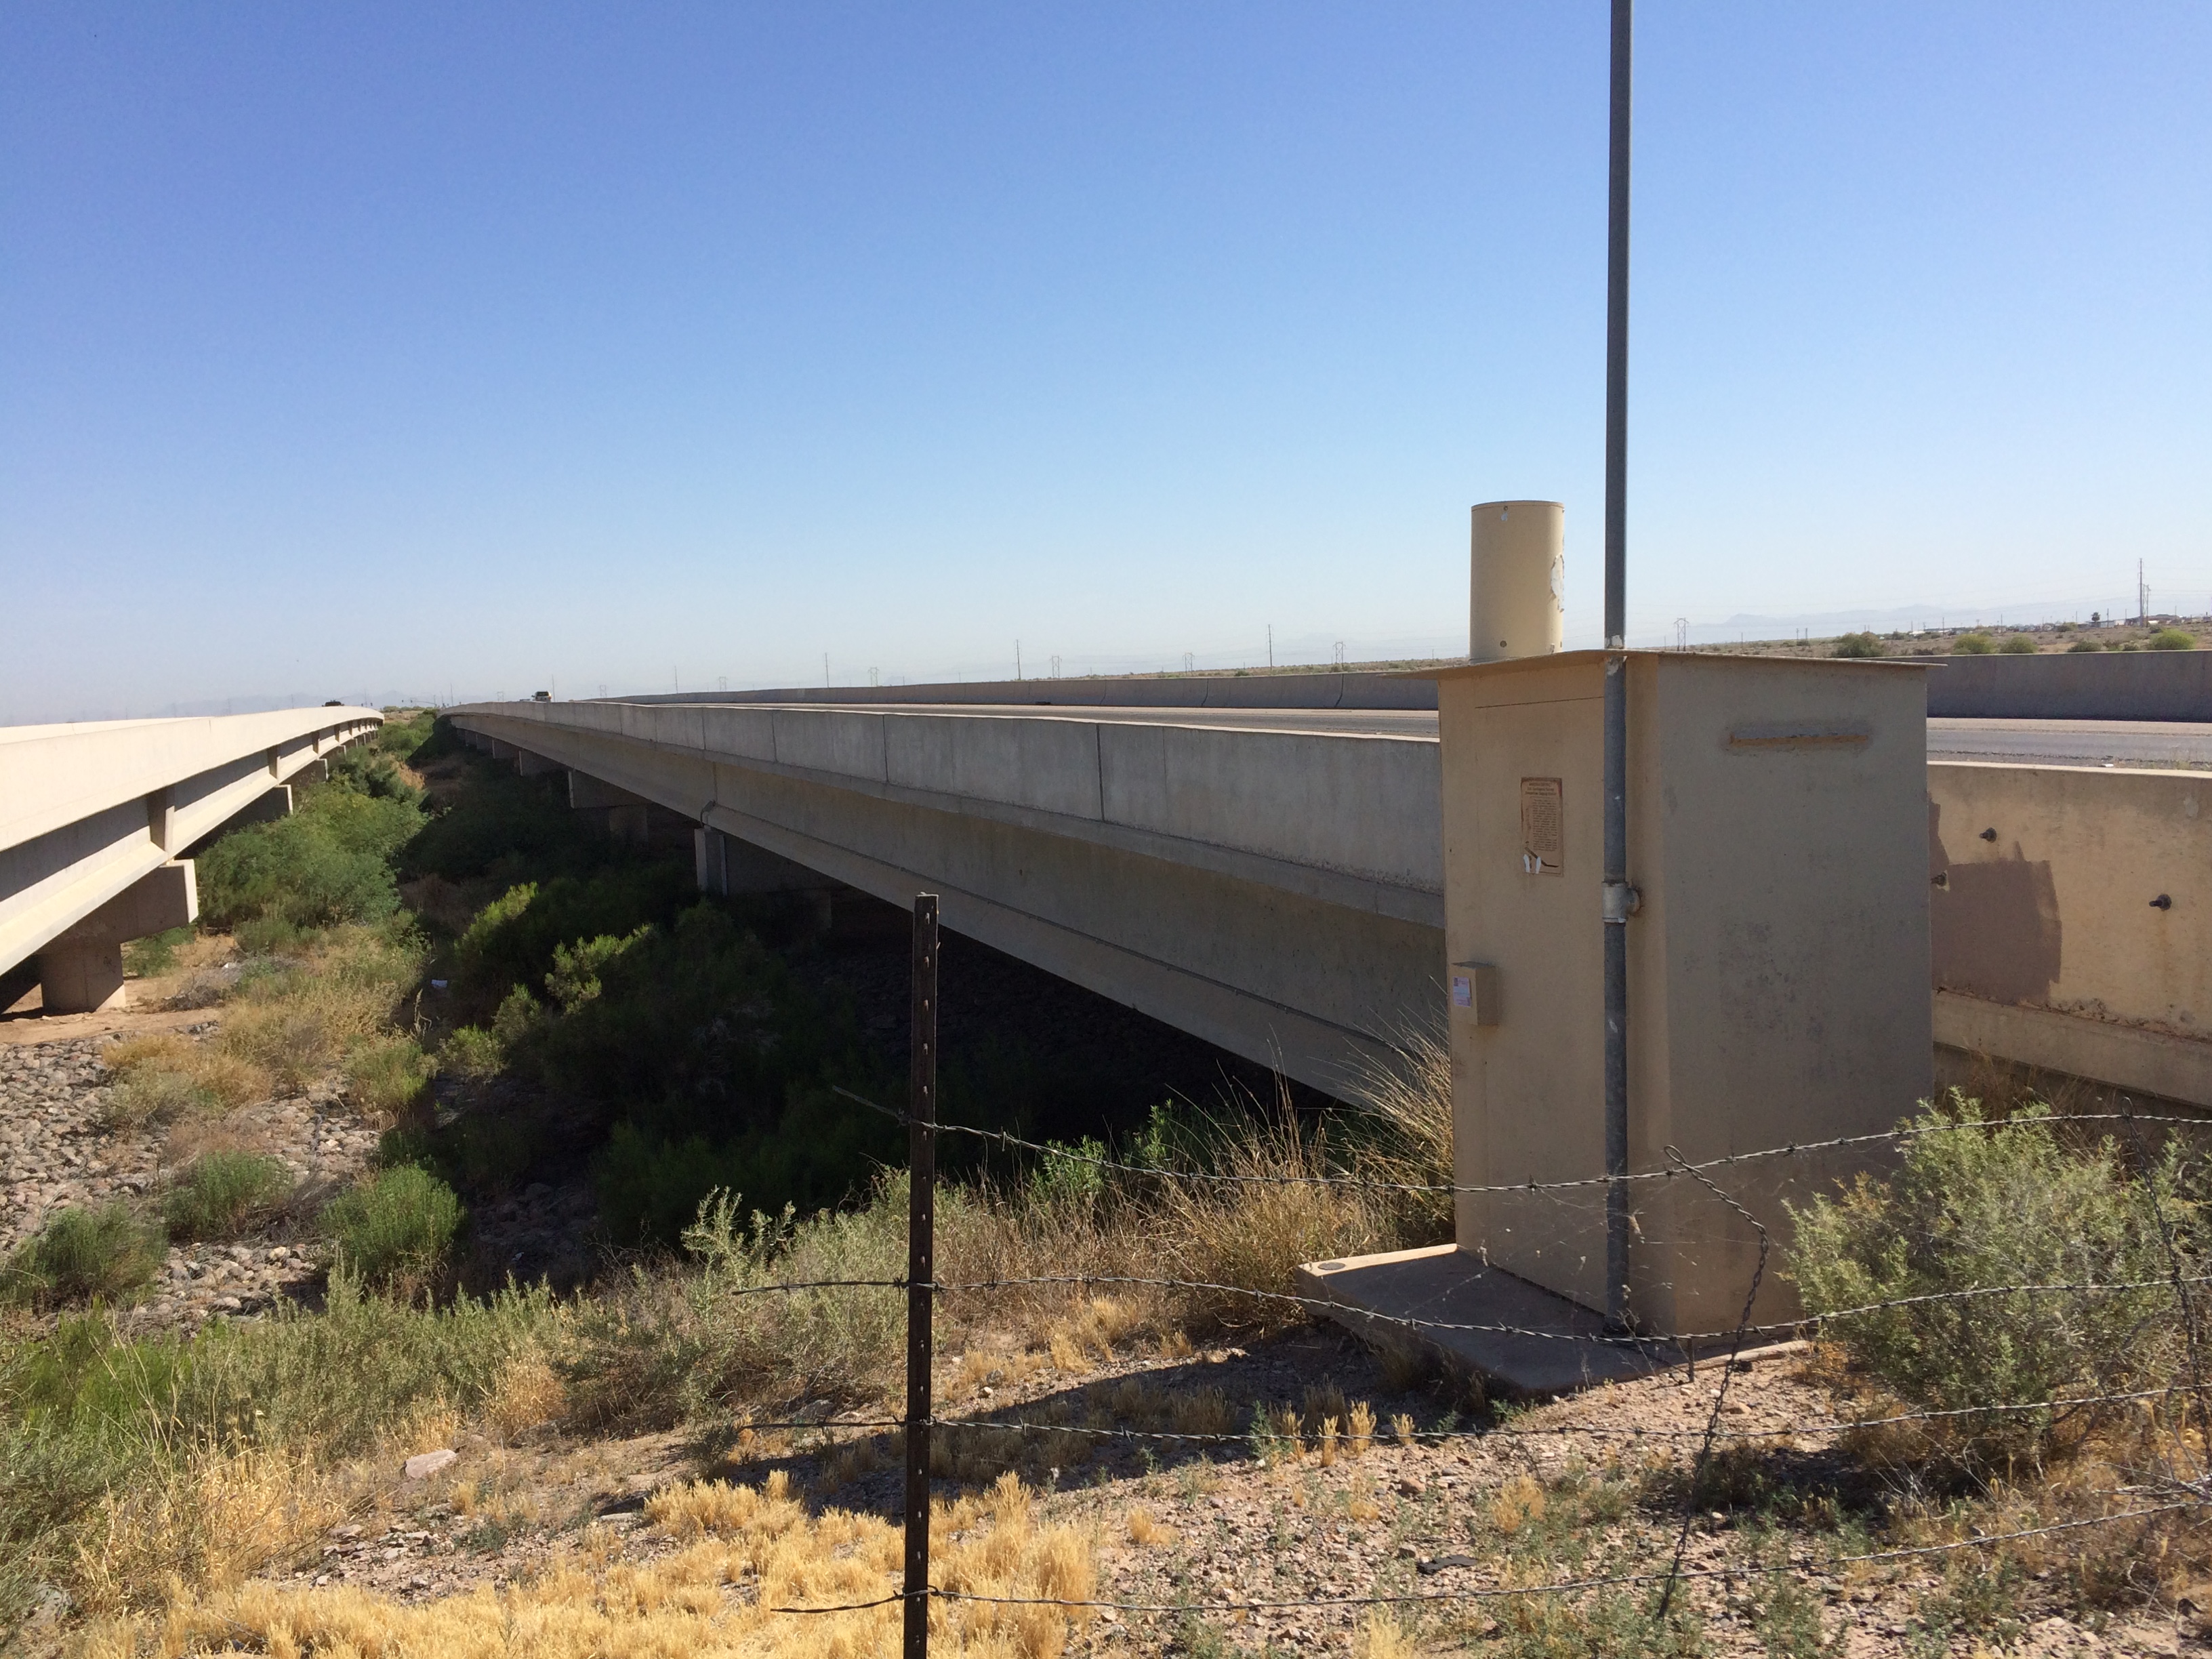
| LOCATION | On Maricopa Road (SR 347) about 5 miles north of Maricopa |
| DRAINAGE AREA | 20,313 mi2 (USGS Streamstats) |
| STREAM TYPE | Natural Stream |
| JURISDICTION | Gila River Indian Community, Arizona |
| WATERSHED | Lower East Maricopa Floodway |
| SECTION/TOWNSHIP/RANGE | S13 T3S R3E |
| LATITUDE | N 33° 10' 14.7" | +33.17076 |
| LONGITUDE | W 112° 00' 21.7" | -112.00601 |
| ARIZONA STATE PLANE | E 672658 | N 789695 |
| USGS QUAD SHEET | Pima Butte 7.5-Minute |
| STREAMGAGE INSTALLATION DATE | 04/09/1995 - WY 1995 |
| PERIOD OF AVAILABLE DATA RECORD | 04/09/1995 - Current |
| LENGTH OF AVAILABLE DATA RECORD (AS OF 10/01/2024) | 29.48 Years | 10,768 Days |
| GAPS (> 2 DAYS) IN RECORD | None |
| STAGE GAGE TYPE | Pressure Transducer |
| STAGE GAGE ELEVATION | 1.36 feet Gage Height |
| STAFF GAGES | 3 |
| CREST STAGE GAGES | 2 |
| ZERO GAGE HEIGHT ELEVATION | 1,115.936 feet NAVD88 |
| POINT OF ZERO FLOW | 1.7 feet Gage Height |
| EXTREME FOR PERIOD OF RECORD | 8,051 cfs | 3.99 feet | 07/31/2006 |
| Current Rating = #3 - Applied since 10/01/2018 | ||
| Discharge (cfs) |
Elevation feet Gage Height |
Elevation feet NAVD88 |
| 0 | 1.70 | 1,117.64 |
| 500 | 3.50 | 1,119.44 |
| 1,000 | 3.99 | 1,119.93 |
| 3,000 | 4.98 | 1,120.92 |
| 5,000 | 5.36 | 1,121.30 |
| 10,000 | 6.08 | 1,122.02 |
| 20,000 | 7.15 | 1,123.09 |
| 50,000 | 9.40 | 1,125.34 |
| 100,000 | 12.05 | 1,127.99 |
| Water Year |
Peak Gage Height (feet) |
Peak Discharge (cfs) |
Date of Peak |
| 2026 | |||
| 2025 | 2.42 | 8 | 09/04/2025 |
| 2024 | None | 0 | None |
| 2023 | None | 0 | None |
| 2022 | None | 0 | None |
| 2021 | None | 0 | None |
| 2020 | None | 0 | None |
| 2019 | 3.33 | 3,119 | 10/13/2018 |
| 2018 | None | 0 | None |
| 2017 | None | 0 | None |
| 2016 | None | 0 | None |
| 2015 | None | 0 | None |
| 2014 | 2.71 | 863 | 09/08/2014 |
| 2013 | None | 0 | None |
| 2012 | 2.31 | 249 | 09/07/2012 |
| 2011 | 1.76 | 19 | 10/05/2010 |
| 2010 | 3.20 | 2,500 | Unknown |
| 2009 | None | 0 | None |
| 2008 | None | 0 | None |
| 2007 | None | 0 | None |
| 2006 | 3.99 | 8,051 | 07/31/2006 |
| 2005 | 1.91 | 38 | 03/14/2005 |
| 2004 | 1.96 | 49 | 08/16/2004 |
| 2003 | None | 0 | None |
| 2002 | None | 0 | None |
| 2001 | 2.04 | 71 | 10/27/2000 |
| 2000 | None | 0 | None |
| 1999 | 2.21 | 162 | 07/07/1999 |
| 1998 | None | 0 | None |
| 1997 | 1.78 | 19 | 08/08/1997 |
| 1996 | 1.96 | 49 | 09/03/1996 |
| 1995 | None | 0 | None |
| Date of Peak |
Time of Peak |
Runoff Start |
Runoff End |
Duration (hours) |
Peak Stage (feet GH) |
Peak Discharge (CFS) |
Water Year |
| View a Plot of These Data | |||||||
| 09/04/2025 | 00:00 | 09/03/2025 21:00 | 09/04/2025 21:00 | 24.0 | 2.42 | 8 | 2025 |
| 02/22/2019 | 06:00 | 02/22/2019 00:15 | 02/22/2019 18:00 | 17.8 | 2.26 | 205 | 2019 |
| 10/13/2018 | 15:12 | 10/13/2018 08:56 | 10/17/2018 12:00 | 99.1 | 3.33 | 3,119 | 2019 |
| 10/02/2018 | 12:39 | 10/02/2018 08:13 | 10/03/2018 15:49 | 31.6 | 2.88 | 1,297 | 2019 |
| 09/27/2014 | 17:45 | 09/27/2014 15:28 | 09/28/2014 17:04 | 25.6 | 1.96 | 50 | 2014 |
| 09/10/2014 | 01:34 | 09/09/2014 16:12 | 09/11/2014 05:04 | 36.9 | 1.91 | 39 | 2014 |
| 09/08/2014 | 13:24 | 09/08/2014 07:09 | 09/09/2014 09:15 | 26.1 | 2.71 | 863 | 2014 |
| 09/07/2012 | 12:27 | 09/07/2012 12:04 | 09/07/2012 23:48 | 11.7 | 2.31 | 249 | 2012 |
| 08/22/2012 | 00:13 | 08/21/2012 22:41 | 08/22/2012 08:30 | 9.8 | 1.76 | 19 | 2012 |
| 08/15/2012 | 02:15 | 08/15/2012 02:15 | 08/15/2012 08:29 | 6.2 | 1.66 | 13 | 2012 |
| 10/05/2010 | 17:29 | 10/05/2010 17:29 | 10/06/2010 03:31 | 10.0 | 1.76 | 19 | 2011 |
| 01/21/2010 | Data Unavailable | Data Unavailable | 3.20 | 2,500 | 2010 | ||
| 08/02/2006 | 10:27 | 08/02/2006 07:27 | 08/05/2006 14:27 | 79.0 | 3.24 | 2,634 | 2006 |
| 07/31/2006 | 18:22 | 07/31/2006 15:42 | 08/02/2006 07:12 | 39.5 | 3.99 | 8,051 | 2006 |
| 03/14/2005 | 06:46 | 02/26/2005 18:37 | 03/26/2005 15:51 | 669 | 1.91 | 38 | 2005 |
| 08/16/2004 | 02:42 | 08/16/2004 01:42 | 08/16/2004 08:07 | 6.4 | 1.96 | 49 | 2004 |
| 10/27/2000 | 08:07 | 10/27/2000 07:06 | 10/28/2000 08:07 | 25.0 | 2.04 | 71 | 2001 |
| 07/07/1999 | 06:27 | 07/07/1999 06:27 | single report | 0.0 | 2.21 | 162 | 1999 |
| Flood Flow Frequency View a plot of Flood Frequncy Data ***NOTE: Flood Flow Frequency data are for information only and should not be considered valid for regulation*** Magnitude and Probability of Instantaneous Peak Flow | Discharge, in cfs, for indicated Recurrence Interval |
|||||||
| USGS StreamStats Flood Flow Frequency | |||||||
| 2-year | 5-year | 10-year | 25-year | 50-year | 100-year | 200-year | 500-year |
| Staff Gage Range | Staff Gage Information | Elevations |
| 2-sections, USGS staff plate | ||
| 0.0 - 7.2 | Located on right side of pier 1 with transducer | Displays in gage height |
| 7.2 - 12.0 | Located on left side of pier 1 with transducer | Displays in gage height | Painted staff Gage |
| 0 - 11 | Painted on pier 1, viewable from southeast bank | Add 1.3 feet to obtain gage height | Painted staff Gage |
| 0 - 10 | Painted on pier 9, viewable from northwest bank | Not tied to gage height |
| Crest Gage Number | Pin Elevation (Feet, Gage Height) |
Additional Information |
| 1 | 1.90 | Lower Crest Gage |
| 2 | 6.65 | Upper Crest Gage |