
Page Last Updated: 04 November 2025
|
|
Page Last Updated: 04 November 2025 |
| ID | Elevation of Instrument in Gage Height |
Elevation of Instrument in Datum |
Period |
| 29007 | 0.00 feet | 2,272.84 feet NAVD88 | 04/07/2020 -- Current |
| 5178 | 0.00 feet | 2,272.84 feet NAVD88 | 06/05/2001 -- 04/07/2020 |
| STATUS | Active |
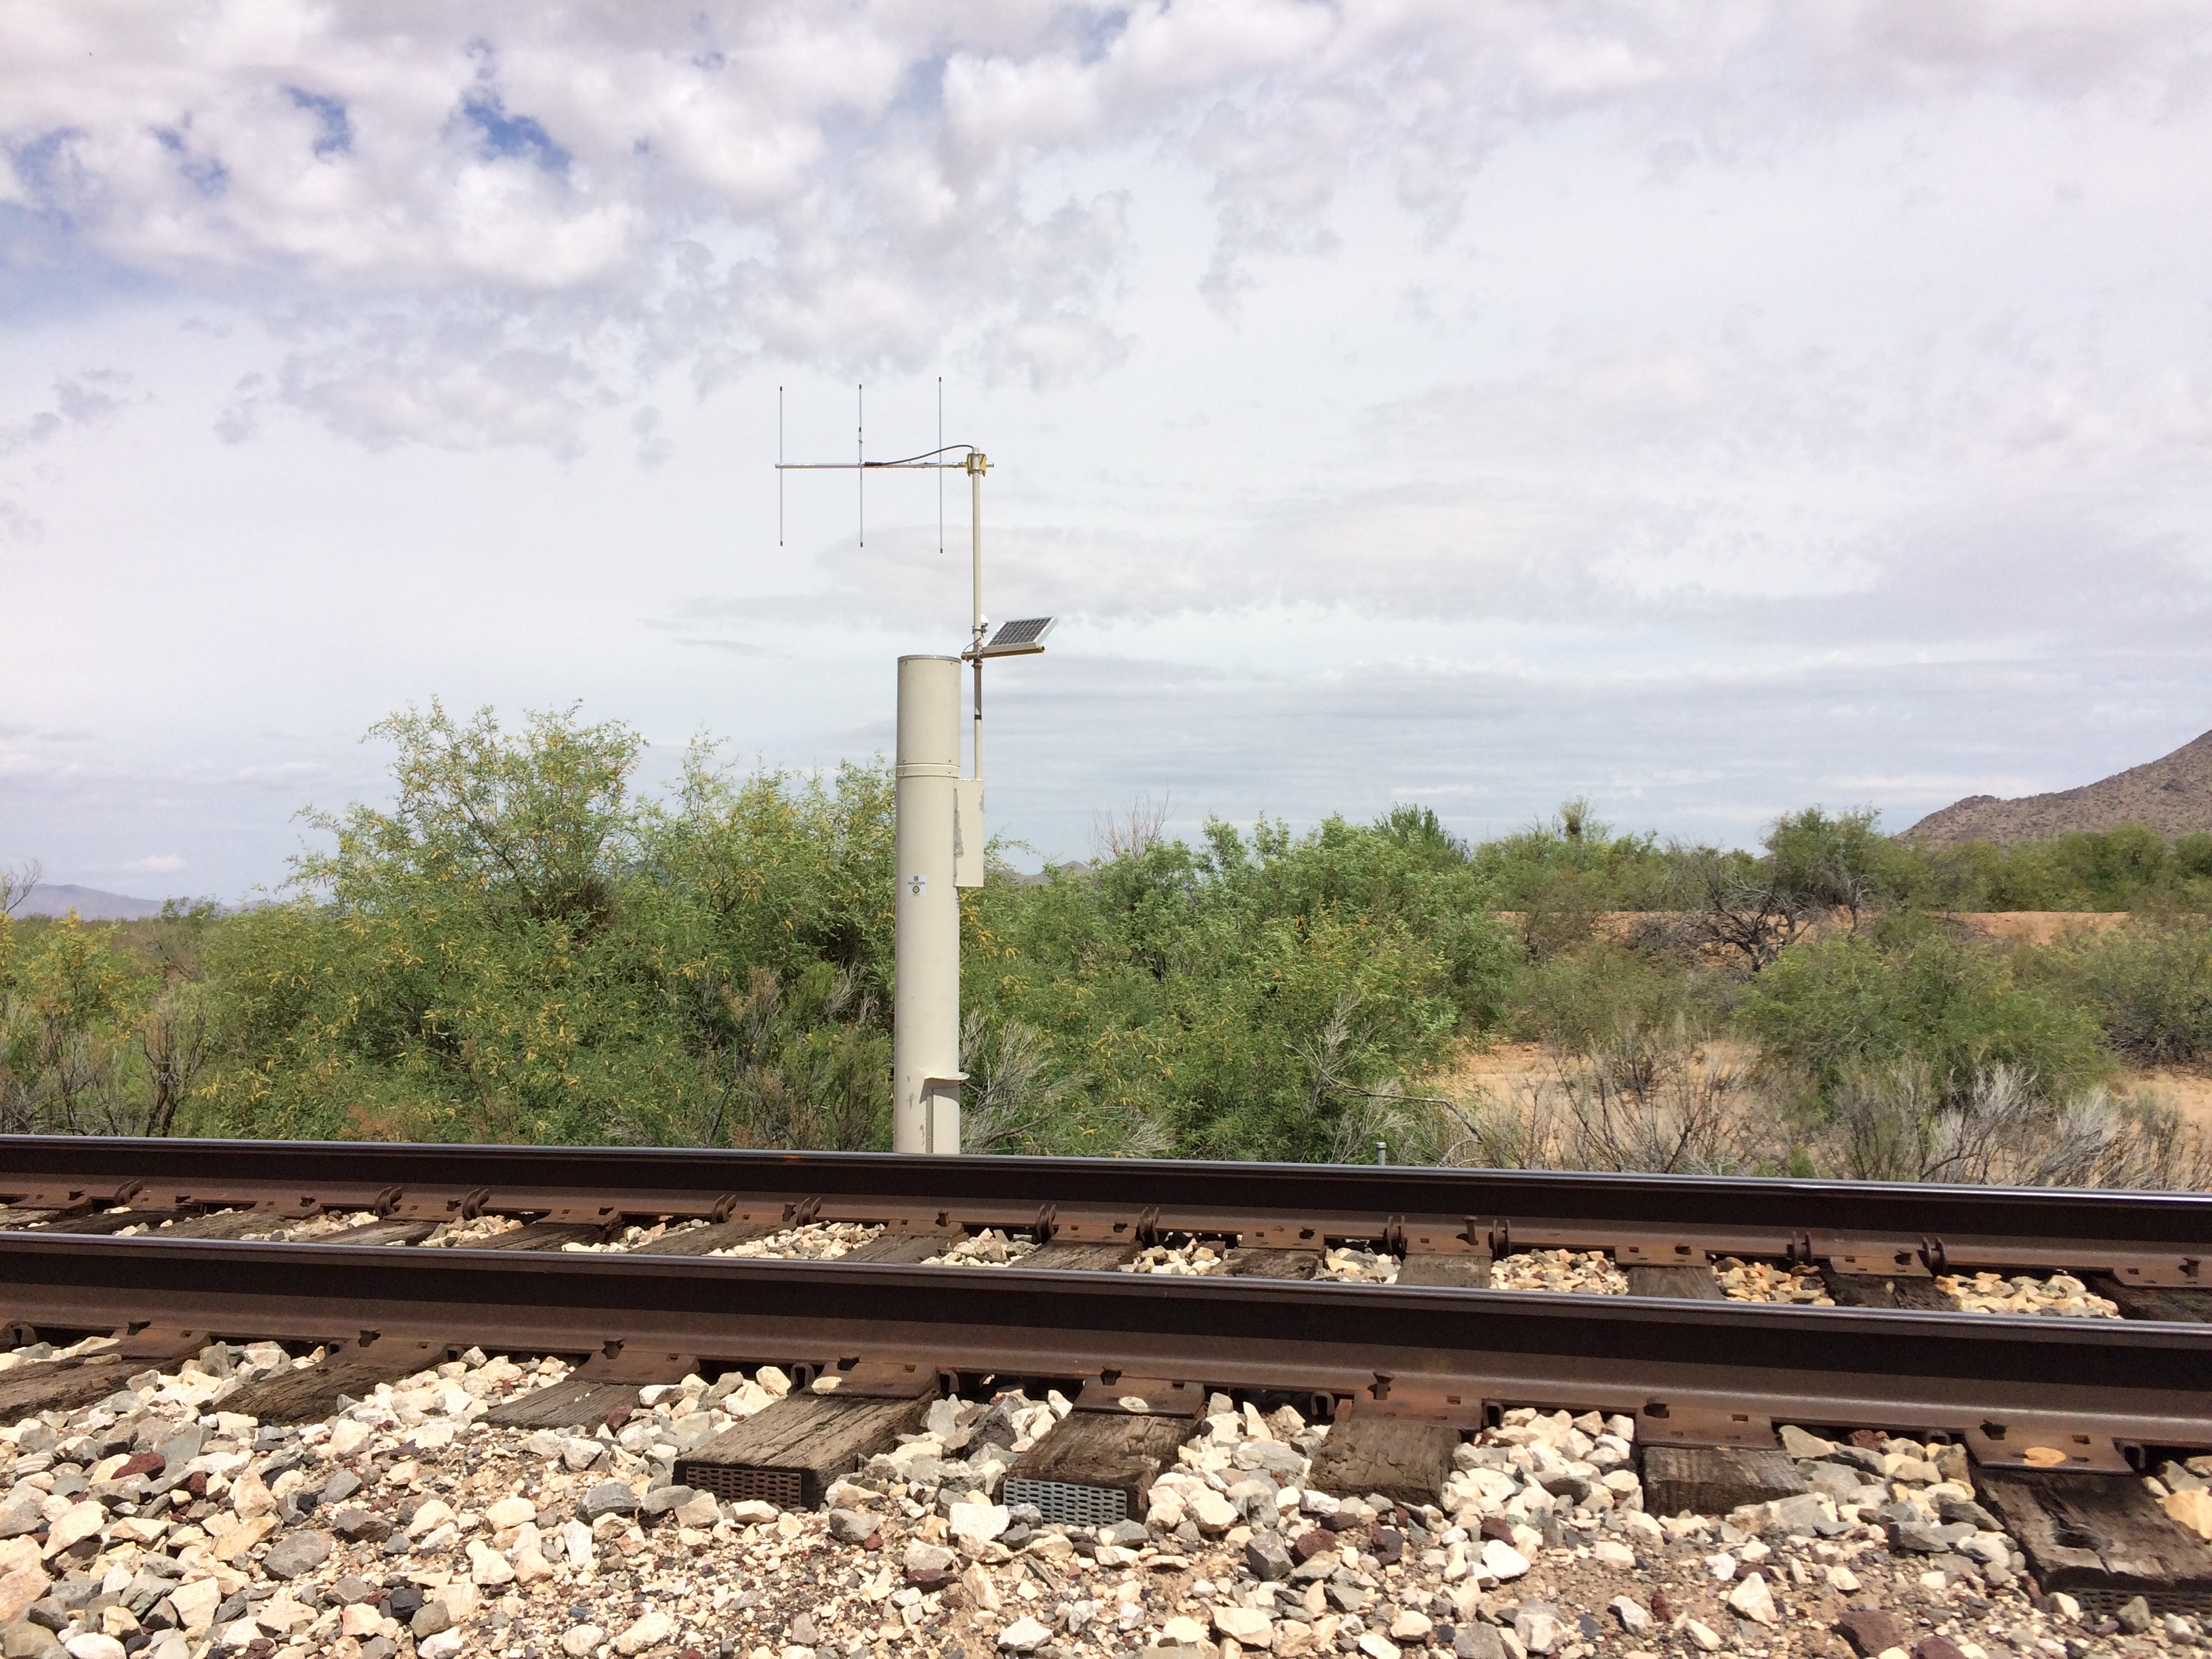
| LOCATION | Along the Arizona and California Railroad east of SR 71 |
| DRAINAGE AREA | 93.4 mi2 (from USGS Streamstats) |
| STREAM TYPE | Levee on natural drainage |
| JURISDICTION | Maricopa County, Arizona |
| WATERSHED | Upper Centennial |
| SECTION/TOWNSHIP/RANGE | S11 T7N R8W |
| LATITUDE | N 33° 58' 00.3" | +33.96675 |
| LONGITUDE | W 113° 04' 07.9" | -113.06887 |
| ARIZONA STATE PLANE | E 350652 | N 1081250 |
| USGS QUAD SHEET | Forepaugh Peak 7.5-Minute |
| STREAMGAGE INSTALLATION DATE | 06/05/2001 - WY 2001 |
| PERIOD OF AVAILABLE DATA RECORD | 06/05/2001 - Current |
| LENGTH OF AVAILABLE DATA RECORD (AS OF 10/01/2024) | 23.32 Years | 8,519 Days |
| GAPS (> 2 DAYS) IN RECORD | None |
| STAGE GAGE TYPE | Pressure Transducer |
| STAGE GAGE ELEVATION | 0.00 feet Gage Height |
| STAFF GAGES | 0 |
| CREST STAGE GAGES | 1 |
| ZERO GAGE HEIGHT ELEVATION | 2,272.84 feet NAVD 1988 |
| POINT OF ZERO FLOW | -0.5 feet Gage Height |
| EXTREME FOR PERIOD OF RECORD | 606 cfs | 3.37 feet | 01/21/2010 |
| To Aguila about 6.3 miles downstream |
To Wenden about 30 miles downstream |
||
| Discharge | Gage Height |
Time (hours) |
Time (hours) |
| 500 | 3.61 | 4.9 | 23.3 |
| 1,000 | 4.57 | 5.6 | 17.5 |
| 3,000 | 6.93 | 2.2 | 10.8 |
| Current Rating = #2 - Applied since 10/01/2020 | ||
| Discharge (cfs) |
Elevation feet Gage Height |
Elevation feet NAVD88 |
| 0 | 0.00 | 2,272.84 |
| 100 | 2.33 | 2,275.17 |
| 200 | 2.76 | 2,275.60 |
| 500 | 3.61 | 2,276.45 |
| 700 | 4.03 | 2,276.87 |
| 1,000 | 4.57 | 2,277.41 |
| 1,500 | 5.30 | 2,278.14 |
| 3,000 | 6.93 | 2,279.77 |
| Water Year |
Peak Gage Height (feet) |
Peak Discharge (cfs) |
Date of Peak |
| 2026 | |||
| 2025 | 0.74 | 21 | 08/25/2025 |
| 2024 | 1.07 | 34 | 02/06/2024 |
| 2023 | 2.12 | 88 | 05/19/2023 |
| 2022 | 0.99 | 31 | 06/29/2022 |
| 2021 | 0.25 | 5 | 07/21/2021 |
| 2020 | 2.15 | 171 | 11/29/2019 |
| 2019 | 0.65 | 29 | 10/13/2018 |
| 2018 | 0.80 | 39 | 08/22/2018 |
| 2017 | 0.66 | 29 | 07/18/2017 |
| 2016 | 0.58 | 24 | 08/23/2016 |
| 2015 | None | 0 | None |
| 2014 | 1.00 | 53 | 07/04/2014 |
| 2013 | 1.51 | 96 | 09/10/2013 |
| 2012 | 1.86 | 135 | 07/14/2012 |
| 2011 | 0.21 | 6 | 12/22/2010 |
| 2010 | 3.37 | 606 | 01/21/2010 |
| 2009 | 3.28 | 556 | 08/22/2009 |
| 2008 | 2.33 | 195 | 08/26/2008 |
| 2007 | 0.28 | 9 | 02/19/2007 |
| 2006 | 0.60 | 26 | 07/25/2006 |
| 2005 | 2.05 | 158 | 11/22/2004 |
| 2004 | None | 0 | None |
| 2003 | 0.12 | 3 | 08/27/2003 |
| 2002 | None | 0 | None |
| 2001 | None | 0 | None |
| Date of Peak |
Time of Peak |
Runoff Start |
Runoff End |
Duration (hours) |
Peak Stage (feet GH) |
Peak Discharge (CFS) |
Water Year |
| View a Plot of These Data | |||||||
| 08/25/2025 | 21:04 | 08/25/2025 20:00 | 08/27/2025 18:00 | 46.0 | 0.74 | 21 | 2025 |
| 03/13/2025 | 14:32 | 03/11/2025 18:00 | 03/16/2025 06:00 | 108.0 | 0.52 | 13 | 2025 |
| 03/07/2025 | 12:00 | 03/07/2025 07:00 | 03/09/2025 06:00 | 47.0 | 0.52 | 13 | 2025 |
| 02/01/2024 | 19:13 | 02/06/2024 14:30 | unknown | 69.5-141.5 | 1.07 | 34 | 2024 |
| 01/23/2024 | 09:59 | 01/22/2024 11:00 | 01/23/2024 18:00 | 31.0 | 0.62 | 15 | 2024 |
| 12/22/2023 | 18:00 | 12/21/2023 18:00 | 12/24/2023 00:00 | 54.0 | 0.79 | 23 | 2024 |
| 11/17/2023 | 06:00 | 11/18/2023 04:00 | 11/19/2023 00:42 | 20.7 | 0.54 | 13 | 2024 |
| 09/02/2023 | 17:01 | 09/02/2023 12:00 | 09/03/2023 13:33 | 25.5 | 1.07 | 34 | 2023 |
| 05/19/2023 | 11:35 | 05/19/2023 06:00 | 05/20/2023 00:00 | 18.0 | 2.12 | 88 | 2023 |
| 07/28/2022 | 09:09 | 07/28/2022 08:35 | 07/29/2022 06:00 | 21.4 | 0.64 | 17 | 2022 |
| 07/26/2022 | 16:04 | 07/26/2022 11:58 | 07/27/2022 08:31 | 20.5 | 0.79 | 23 | 2022 |
| 06/29/2022 | 18:46 | 06/29/2022 18:29 | 06/30/2022 15:13 | 20.7 | 0.99 | 31 | 2022 |
| 08/13/2021 | 23:03 | 08/13/2021 23:03 | 08/14/2021 00:20 | 1.3 | 0.13 | 2 | 2021 |
| 07/21/2021 | 16:23 | 07/21/2021 16:11 | 07/21/2021 18:20 | 2.2 | 0.25 | 5 | 2021 |
| 03/19/2020 | 00:00 | 03/18/2020 18:08 | 03/20/2020 17:06 | 47.0 | 0.75 | 35 | 2020 |
| 03/13/2020 | 00:00 | 03/11/2020 03:52 | 03/15/2020 18:00 | 110.1 | 1.00 | 53 | 2020 |
| 12/24/2019 | 12:00 | 12/24/2019 08:55 | 12/25/2019 05:03 | 20.1 | 0.38 | 13 | 2020 |
| 11/29/2019 | 08:09 | 11/29/2019 00:43 | 11/30/2019 00:00 | 23.3 | 2.15 | 171 | 2020 |
| 11/21/2019 | 14:03 | 11/21/2019 13:52 | 11/21/2019 18:00 | 4.1 | 0.78 | 37 | 2020 |
| 11/20/2019 | 06:47 | 11/20/2019 01:49 | 11/21/2019 06:00 | 28.2 | 0.55 | 23 | 2020 |
| 09/26/2019 | 08:04 | 09/26/2019 06:00 | 09/26/2019 18:00 | 12.0 | 0.35 | 12 | 2019 |
| 01/15/2019 | 13:42 | 01/15/2019 12:52 | 01/16/2019 10:44 | 21.9 | 0.53 | 22 | 2019 |
| 10/14/2018 | 17:42 | 10/14/2018 17:33 | 10/15/2018 00:00 | 6.5 | 0.60 | 26 | 2019 |
| 10/13/2018 | 09:01 | 10/13/2018 08:50 | 10/13/2018 18:00 | 9.2 | 0.65 | 29 | 2019 |
| 10/07/2018 | 01:24 | 10/07/2018 00:53 | 10/07/2018 12:00 | 11.1 | 0.60 | 26 | 2019 |
| 08/22/2018 | 20:33 | 08/22/2018 20:21 | 08/23/2018 16:31 | 20.2 | 0.80 | 39 | 2018 |
| 07/28/2018 | 21:10 | 07/28/2018 20:48 | 07/29/2018 10:43 | 13.9 | 0.63 | 28 | 2018 |
| 07/18/2017 | 19:31 | 07/18/2017 19:21 | 07/19/2017 00:00 | 4.7 | 0.66 | 29 | 2017 |
| 02/28/2017 | 06:00 | 02/27/2017 23:52 | 02/28/2017 23:54 | 24.0 | 0.48 | 19 | 2017 |
| 01/20/2017 | 23:30 | 01/20/2017 22:49 | 01/21/2017 01:56 | 3.1 | 0.53 | 22 | 2017 |
| 08/23/2016 | 02:27 | 08/23/2016 01:53 | 08/23/2016 18:00 | 16.1 | 0.58 | 24 | 2016 |
| 08/22/2016 | 15:30 | 08/22/2016 15:11 | 08/22/2016 20:19 | 5.1 | 0.50 | 20 | 2016 |
| 07/04/2014 | 04:10 | 07/03/2014 23:04 | 07/04/2014 11:13 | 12.2 | 1.00 | 53 | 2014 |
| 09/10/2013 | 16:36 | 09/10/2013 14:41 | 09/11/2013 01:00 | 10.3 | 1.51 | 96 | 2013 |
| 08/27/2013 | 00:34 | 08/26/2013 21:17 | 08/27/2013 09:19 | 12.0 | 0.90 | 46 | 2013 |
| 08/24/2013 | 11:37 | 08/24/2013 05:59 | 08/25/2013 05:03 | 23.1 | 1.39 | 86 | 2013 |
| 07/14/2012 | 23:44 | 07/14/2012 21:02 | 07/15/2012 15:15 | 18.2 | 1.86 | 135 | 2012 |
| 12/22/2010 | 23:20 | 12/22/2010 21:43 | 12/23/2010 10:24 | 12.7 | 0.21 | 6 | 2011 |
| 01/21/2010 | 22:57 | 01/21/2010 04:21 | 01/23/2010 06:07 | 49.8 | 3.37 | 606 | 2010 |
| 08/22/2009 | 17:19 | 08/22/2009 10:07 | 08/23/2009 10:59 | 24.9 | 3.28 | 556 | 2009 |
| 12/18/2008 | 00:05 | 12/17/2008 23:07 | 12/18/2008 08:58 | 9.9 | 0.13 | 3 | 2009 |
| 11/27/2008 | 03:38 | 11/27/2008 00:30 | 11/28/2008 10:03 | 33.6 | 0.43 | 16 | 2009 |
| 08/26/2008 | 00:01 | 08/25/2008 20:10 | 08/26/2008 22:01 | 25.9 | 2.33 | 195 | 2008 |
| 07/10/2008 | 18:14 | 07/10/2008 17:40 | 07/11/2008 15:02 | 21.4 | 0.51 | 20 | 2008 |
| 07/04/2008 | 21:03 | 07/04/2008 20:47 | 07/05/2008 10:15 | 13.5 | 0.58 | 24 | 2008 |
| 02/19/2007 | 17:00 | 02/19/2007 15:50 | 02/20/2007 10:54 | 19.1 | 0.28 | 9 | 2007 |
| 07/25/2006 | 20:51 | 07/25/2006 20:44 | 07/26/2006 15:41 | 19.0 | 0.60 | 26 | 2006 |
| 10/18/2005 | 10:27 | 10/18/2005 01:07 | 10/19/2005 15:59 | 38.9 | 0.57 | 24 | 2006 |
| 08/12/2005 | 16:00 | 08/12/2005 14:50 | 08/12/2005 22:00 | 7.2 | 0.22 | 6 | 2005 |
| 02/12/2005 | 05:59 | 02/12/2005 04:10 | 02/12/2005 14:39 | 10.5 | 0.32 | 11 | 2005 |
| 01/04/2005 | 19:25 | 01/04/2005 00:28 | 01/07/2005 02:38 | 74.2 | 2.00 | 152 | 2005 |
| 12/29/2004 | 09:32 | 12/29/2004 08:59 | 12/30/2004 14:38 | 29.7 | 0.68 | 30 | 2005 |
| 11/22/2004 | 13:07 | 11/21/2004 19:25 | 11/23/2004 14:36 | 43.2 | 2.05 | 158 | 2005 |
| 11/07/2004 | 23:26 | 11/07/2004 22:11 | 11/08/2004 14:35 | 16.4 | 0.43 | 16 | 2005 |
| 10/21/2004 | 19:33 | 10/21/2004 14:33 | 10/22/2004 08:33 | 18.0 | 1.45 | 91 | 2005 |
| 08/27/2003 | 15:58 | 08/27/2003 15:48 | 08/27/2003 15:58 | 0.2 | 0.12 | 3 | 2003 |
| Flood Flow Frequency View a plot of Flood Frequncy Data ***NOTE: Flood Flow Frequency data are for information only and should not be considered valid for regulation*** Magnitude and Probability of Instantaneous Peak Flow | Discharge, in cfs, for indicated Recurrence Interval |
|||||||
| FEMA Flood Insurance Study (by graphical extension) | |||||||
| 2-year | 5-year | 10-year | 20-year | 50-year | 100-year | 200-year | 500-year |
| ----- | ----- | 2,400 | ----- | 6,750 | 8,800 | ----- | ----- |
| USGS StreamStats Flood Flow Frequency | |||||||
| 2-year | 5-year | 10-year | 25-year | 50-year | 100-year | 200-year | 500-year |
| Flood Flow Frequency Based on HECWRC implementation of Bulletin 17B, n=21, 2001-2021 |
|||||||
| 2-year | 5-year | 10-year | 20-year | 50-year | 100-year | 200-year | 500-year |
| Crest Gage Number | Pin Elevation (Feet, Gage Height) |
Additional Information |
| 1 | 0.17 | Located on left bank near transducer |