
Page Last Updated: 10 March, 2025
|
|
Page Last Updated: 10 March, 2025 |
| ID | Elevation of Instrument in Gage Height |
Elevation of Instrument in Datum |
Period |
| 20607 | 0.15 feet | 2,285.15 feet NAVD88 | 08/16/2016 -- Current |
| STATUS | Active Alert2 Station |
| LOCATION | Located on Galloway Road about 1/8 mile north of Cave Creek Road |
| DRAINAGE AREA | 6.6 mi2 |
| STREAM TYPE | Natural |
| JURISDICTION | Cave Creek, Arizona |
| WATERSHED | Cave Creek |
| SECTION/TOWNSHIP/RANGE | S34 T6N R4E |
| LATITUDE | N 33° 49' 54.1" | +33.83170 |
| LONGITUDE | W 111° 55' 43.3" | -111.92870 |
| ARIZONA STATE PLANE | E 696370 | N 1030150 |
| USGS QUAD SHEET | Cave Creek 7.5-Minute |
| STREAMGAGE INSTALLATION DATE | 08/16/2016 - WY 2016 |
| PERIOD OF AVAILABLE DATA RECORD | 08/16/2016 - Current |
| LENGTH OF AVAILABLE DATA RECORD (AS OF 10/01/2024) | 8.13 Years | 2,968 Days |
| GAPS (> 2 DAYS) IN RECORD | None |
| STAGE GAGE TYPE | Pressure Transducer |
| STAGE GAGE ELEVATION | 0.15 feet Gage Height |
| STAFF GAGES | 1 |
| CREST STAGE GAGES | 1 |
| ZERO GAGE HEIGHT ELEVATION | 2,285.00 feet NAVD88 |
| POINT OF ZERO FLOW | 0.1 feet Gage Height |
| EXTREME FOR PERIOD OF RECORD | 1,518 cfs | 2.52 feet GH | 08/23/2018 |
| Current Rating = #2 - Applied since 03/10/2025 | ||
| Discharge (cfs) |
Elevation feet Gage Height |
Elevation feet NAVD88 |
| 0 | 0.00 | 2,285.00 |
| 50 | 0.99 | 2,285.99 |
| 100 | 1.20 | 2,286.20 |
| 300 | 1.83 | 2,286.83 |
| 500 | 2.30 | 2,287.30 |
| 800 | 2.91 | 2,287.91 |
| 1,000 | 3.29 | 2,288.29 |
| 2,000 | 4.48 | 2,289.84 |
| 3,000 | 6.14 | 2,291.14 |
| 5,000 | 8.50 | 2,293.50 |
| Water Year |
Peak Gage Height (feet) |
Peak Discharge (cfs) |
Date of Peak |
| 2025 | |||
| 2024 | None | 0 | None |
| 2023 | 1.66 | 535 | 08/31/2023 |
| 2022 | 1.12 | 137 | 08/19/2022 |
| 2021 | 1.40 | 304 | 08/18/2021 |
| 2020 | None | 0 | None |
| 2019 | 1.13 | 140 | 10/07/2018 |
| 2018 | 2.52 | 1,518 | 08/23/2018 |
| 2017 | 0.79 | 19 | 02/28/2017 |
| 2016 (partial) | None | 0 | None |
| Date of Peak |
Time of Peak |
Runoff Start |
Runoff End |
Duration (hours) |
Peak Stage (feet GH) |
Peak Discharge (CFS) |
Water Year |
| View a Plot of These Data | |||||||
| 08/31/2023 | 23:09 | 08/31/2023 22:37 | 09/01/2023 00:00 | 1.4 | 1.66 | 535 | 2023 |
| 08/19/2022 | 17:44 | 08/19/2022 17:31 | 08/19/2022 18:38 | 1.1 | 1.12 | 137 | 2022 |
| 08/18/2021 | 14:27 | 08/18/2021 13:57 | 08/18/2021 14:47 | 0.8 | 1.40 | 304 | 2021 |
| 10/07/2018 | 04:21 | 10/07/2018 04:11 | 10/07/2018 04:53 | 0.7 | 1.13 | 140 | 2019 |
| 08/23/2018 | 17:18 | 08/23/2018 17:03 | 08/23/2018 17:59 | 0.9 | 2.52 | 1,518 | 2018 |
| 02/28/2017 | 08:18 | 02/28/2017 07:50 | 02/28/2017 09:13 | 1.4 | 0.79 | 19 | 2017 |
| Flood Flow Frequency View a plot of Flood Frequncy Data ***NOTE: Flood Flow Frequency data are for information only and should not be considered valid for regulation*** Magnitude and Probability of Instantaneous Peak Flow | Discharge, in cfs, for indicated Recurrence Interval |
|||||||
| FEMA Flood Insurance Study | |||||||
| 2-year | 5-year | 10-year | 20-year | 50-year | 100-year | 200-year | 500-year |
| ----- | ----- | ----- | ----- | ----- | 3,100 | ----- | ----- |
| USGS StreamStats Flood Flow Frequency | |||||||
| 2-year | 5-year | 10-year | 25-year | 50-year | 100-year | 200-year | 500-year |
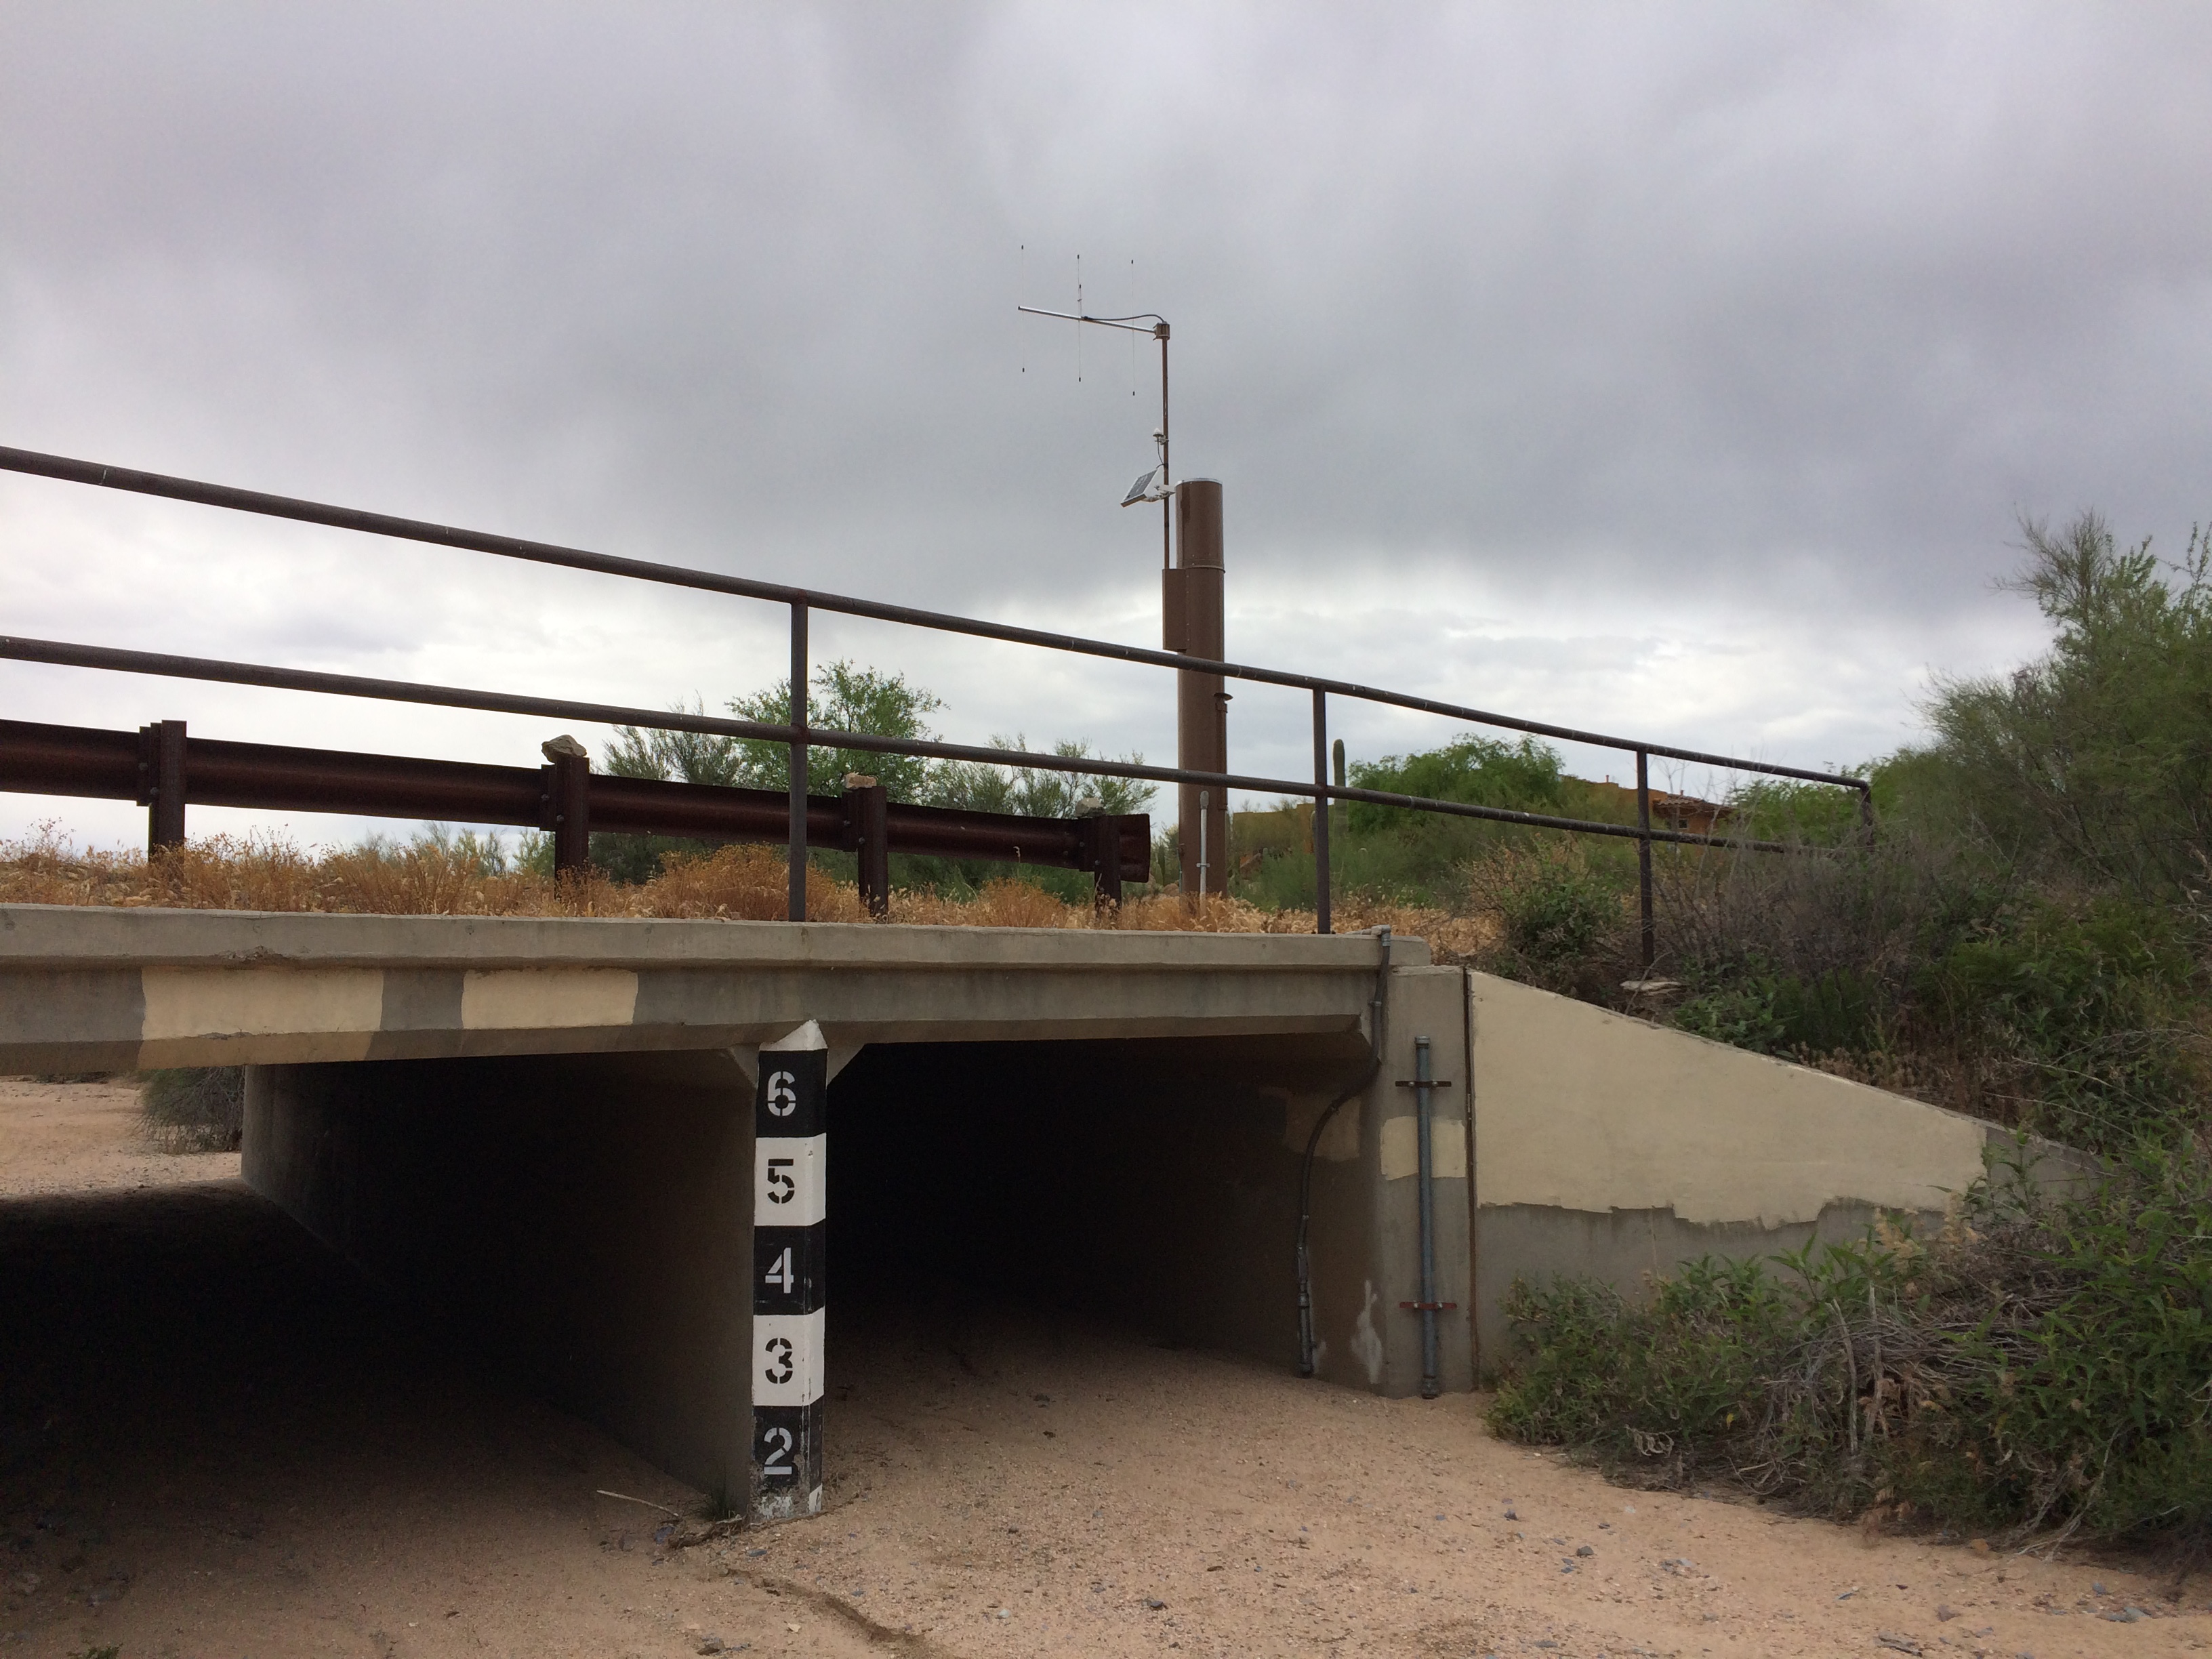
| Range | Location |
| 0 - 6 | Located on upstream pier adjacent to transducer |
| Crest Gage Number | Pin Elevation (Feet, Gage Height) |
Additional Information |
| 1 | 0.31 | Located on right side of culvert, near transducer gage |