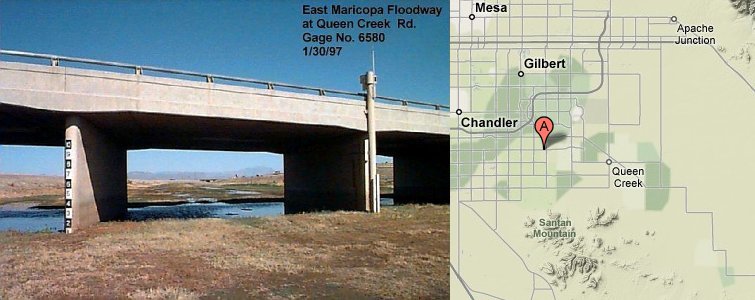
Station Name: East Maricopa Floodway @ Queen Creek Rd.
|
Station ID Number History: |
4620 since 09/18/92 5650 from 01/18/89 – 09/18/92 |
|
Station Type: |
Rain / Stream |
|
Data Begins: |
09/18/1992 |
|
Years of Record: |
13.71 (as of 10/01/02) |
|
Data Repeater: |
Thompson Peak |
|
TRS: |
T2S-R6E-Section 15 |
|
Latitude: |
33° 15’ 50" |
|
Longitude: |
111° 43’ 35" |
|
Elevation: |
1,315 ft. msl |
|
Location: |
1/3 mi. west of Queen Creek Road and Higley Road |
|
Data Record: |
|
|
Partial Months (>10 days missing): |
None |
|
Missing Months: |
None |
|
Remarks: |
Records Good |
Data Statistics for Period of Record:
|
Number of storms greater than 1 inch in 24 hours: |
7 |
|
Number of storms greater than 2 inches in 24 hours: |
1 |
|
Number of storms greater than 3 inches in 24 hours: |
0 |
|
|
|
|
Greatest 15 minute total: |
0.87" on 07/29/99 |
|
Greatest 1 hour total: |
1.81" on 07/29/99 |
|
Greatest 3 hour total: |
2.01" on 07/29/99 |
|
Greatest 6 hour total: |
2.01" on 07/29/99 |
|
Greatest 24 hour total: |
2.01" on 07/29/99 |
Water Year Totals: (Mean of Complete Water Years [13]
= 6.31 inches)
|
Water Year |
Total |
Water Year |
Total |
Water Year |
Total |
|
2010 |
|
2000 |
3.11 |
1990 |
6.10 |
|
2009 |
|
1999 |
6.81 |
1989 |
M |
|
2008 |
|
1998 |
4.76 |
1988 |
|
|
2007 |
|
1997 |
2.13 |
1987 |
|
|
2006 |
|
1996 |
5.35 |
1986 |
|
|
2005 |
|
1995 |
7.83 |
1985 |
|
|
2004 |
|
1994 |
5.71 |
1984 |
|
|
2003 |
|
1993 |
10.47 |
1983 |
|
|
2002 |
3.31 |
1992 |
11.89 |
1982 |
|
|
2001 |
8.74 |
1991 |
5.87 |
1981 |
|
M: One or more months contain partial or missing
data
S: Data looks suspicious when compared to nearby
gages
Click Here to download a .pdf (Adobe Acrobat) file containing all daily rainfall totals for this station.