Links
Test
Weather
Rainfall
 =
Gage has reported that no precipitation has occurred in the time step
listed above.
=
Gage has reported that no precipitation has occurred in the time step
listed above.
M = Gage has not reported in last 6 hours. Data missing.
Rainfall
M = Gage has not reported in last 6 hours. Data missing.

MCAQD Current Data
+ = This station does not have the specific air quality sensor you selected at its location.
Click on these tabs to view the different datasets available on this website.
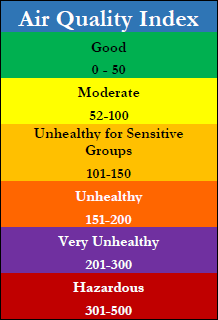
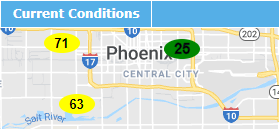 | Current Conditions Map (NowCast Index) This map displays the NowCast Index, which is a short-term air pollution average (one-hour) that can reflect changing conditions. The NowCast Index uses the same color and scale as the AQI and can provide a rough estimate of how hour-to-hour pollution levels compare to 8- or 24-hour health standards. NowCast values change rapidly and should not be confused with official daily air pollution averages. |
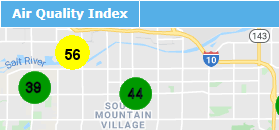 |
Air Quality Index Map (AQI) This map displays the AQI, which is a longer-term 8-hour or 24-hour (dependent on the pollutant) air pollution average related to health standards and regulatory air quality requirements. The calculation used in this map is similar, but not exact, to the official daily averages. |
 | Raw Data Map This map displays LIVE data from all monitored parameters at each site, such as hourly or five-minute pollution concentrations and/or meteorological data. |
+ = This station does not have the specific air quality sensor you selected at its location.
Warning: The air quality data are generated using automated air monitoring analyzers and meteorological instruments; data are preliminary and have not been subjected to a quality assurance review to verify accuracy. The data are intended for public awareness of current air quality conditions only. Invalid data can be reported temporarily by a monitor due to a variety of events such as a power interruption or an instrument malfunction.
Use the blue menu bar across the top of the page to select the type of data you seek.
· The Current Conditions tab provides the NowCast value.
· The Air Quality Index tab provides the AQI value. The pollutants and meteorological conditions measured vary by site.
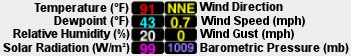
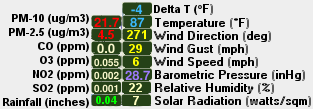
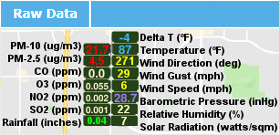
· The Raw Data tab provides current pollutant and meteorological data. The O3 and PM values are found under their own tab; CO, NO2, SO2, and meteorological data are found under the Current Data tab. The PM10 and meteorological data update every 5-minutes with remaining pollutants updating every half-hour. There are links to the Maricopa County Flood Control Department’s weather and rain data maps as well.
If you select a pollutant at any site, you can view the Last 300 Records data records and a graph under View Plot of Data Here.
Sources:
Maricopa County Air Quality Department
Maricopa County Flood Control District
National Weather Service (NWS) Warning Areas provided by NWS Weather Ready Nation (WRN) Active Alerts
Use the blue menu bar across the top of the page to select the type of data you seek.
· The Current Conditions tab provides the NowCast value.
· The Air Quality Index tab provides the AQI value. The pollutants and meteorological conditions measured vary by site.
· The Raw Data tab provides current pollutant and meteorological data. The O3 and PM values are found under their own tab; CO, NO2, SO2, and meteorological data are found under the Current Data tab. The PM10 and meteorological data update every 5-minutes with remaining pollutants updating every half-hour. There are links to the Maricopa County Flood Control Department’s weather and rain data maps as well.
If you select a pollutant at any site, you can view the Last 300 Records data records and a graph under View Plot of Data Here.
Sources:
Maricopa County Air Quality Department
Maricopa County Flood Control District
National Weather Service (NWS) Warning Areas provided by NWS Weather Ready Nation (WRN) Active Alerts
Air Monitoring
Ceresa Stewart at [email protected]
Ben Davis at [email protected]
Maricopa County Air Quality Department
2145 S. 11th Ave #170
Phoenix, AZ 85007
Map Produced by FCDMC Flood Warning Branch
Flood Control District of Maricopa County Website
Ceresa Stewart at [email protected]
Ben Davis at [email protected]
Maricopa County Air Quality Department
2145 S. 11th Ave #170
Phoenix, AZ 85007
Map Produced by FCDMC Flood Warning Branch
Flood Control District of Maricopa County Website