
Page Last Updated: 04 November 2025
|
|
Page Last Updated: 04 November 2025 |
| ID | Elevation of Instrument in Gage Height |
Elevation of Instrument in Datum |
Period |
| 25707 | 0.65 feet | 1,261.35 feet NAVD88 | 04/07/2020 -- Current |
| 5123 | 0.65 feet | 1,261.35 feet NAVD88 | 10/01/2017 -- 04/07/2020 |
| 5123 | 0.65 feet | 1,261.65 feet NAVD88 | 07/09/2003 -- 10/01/2017 |
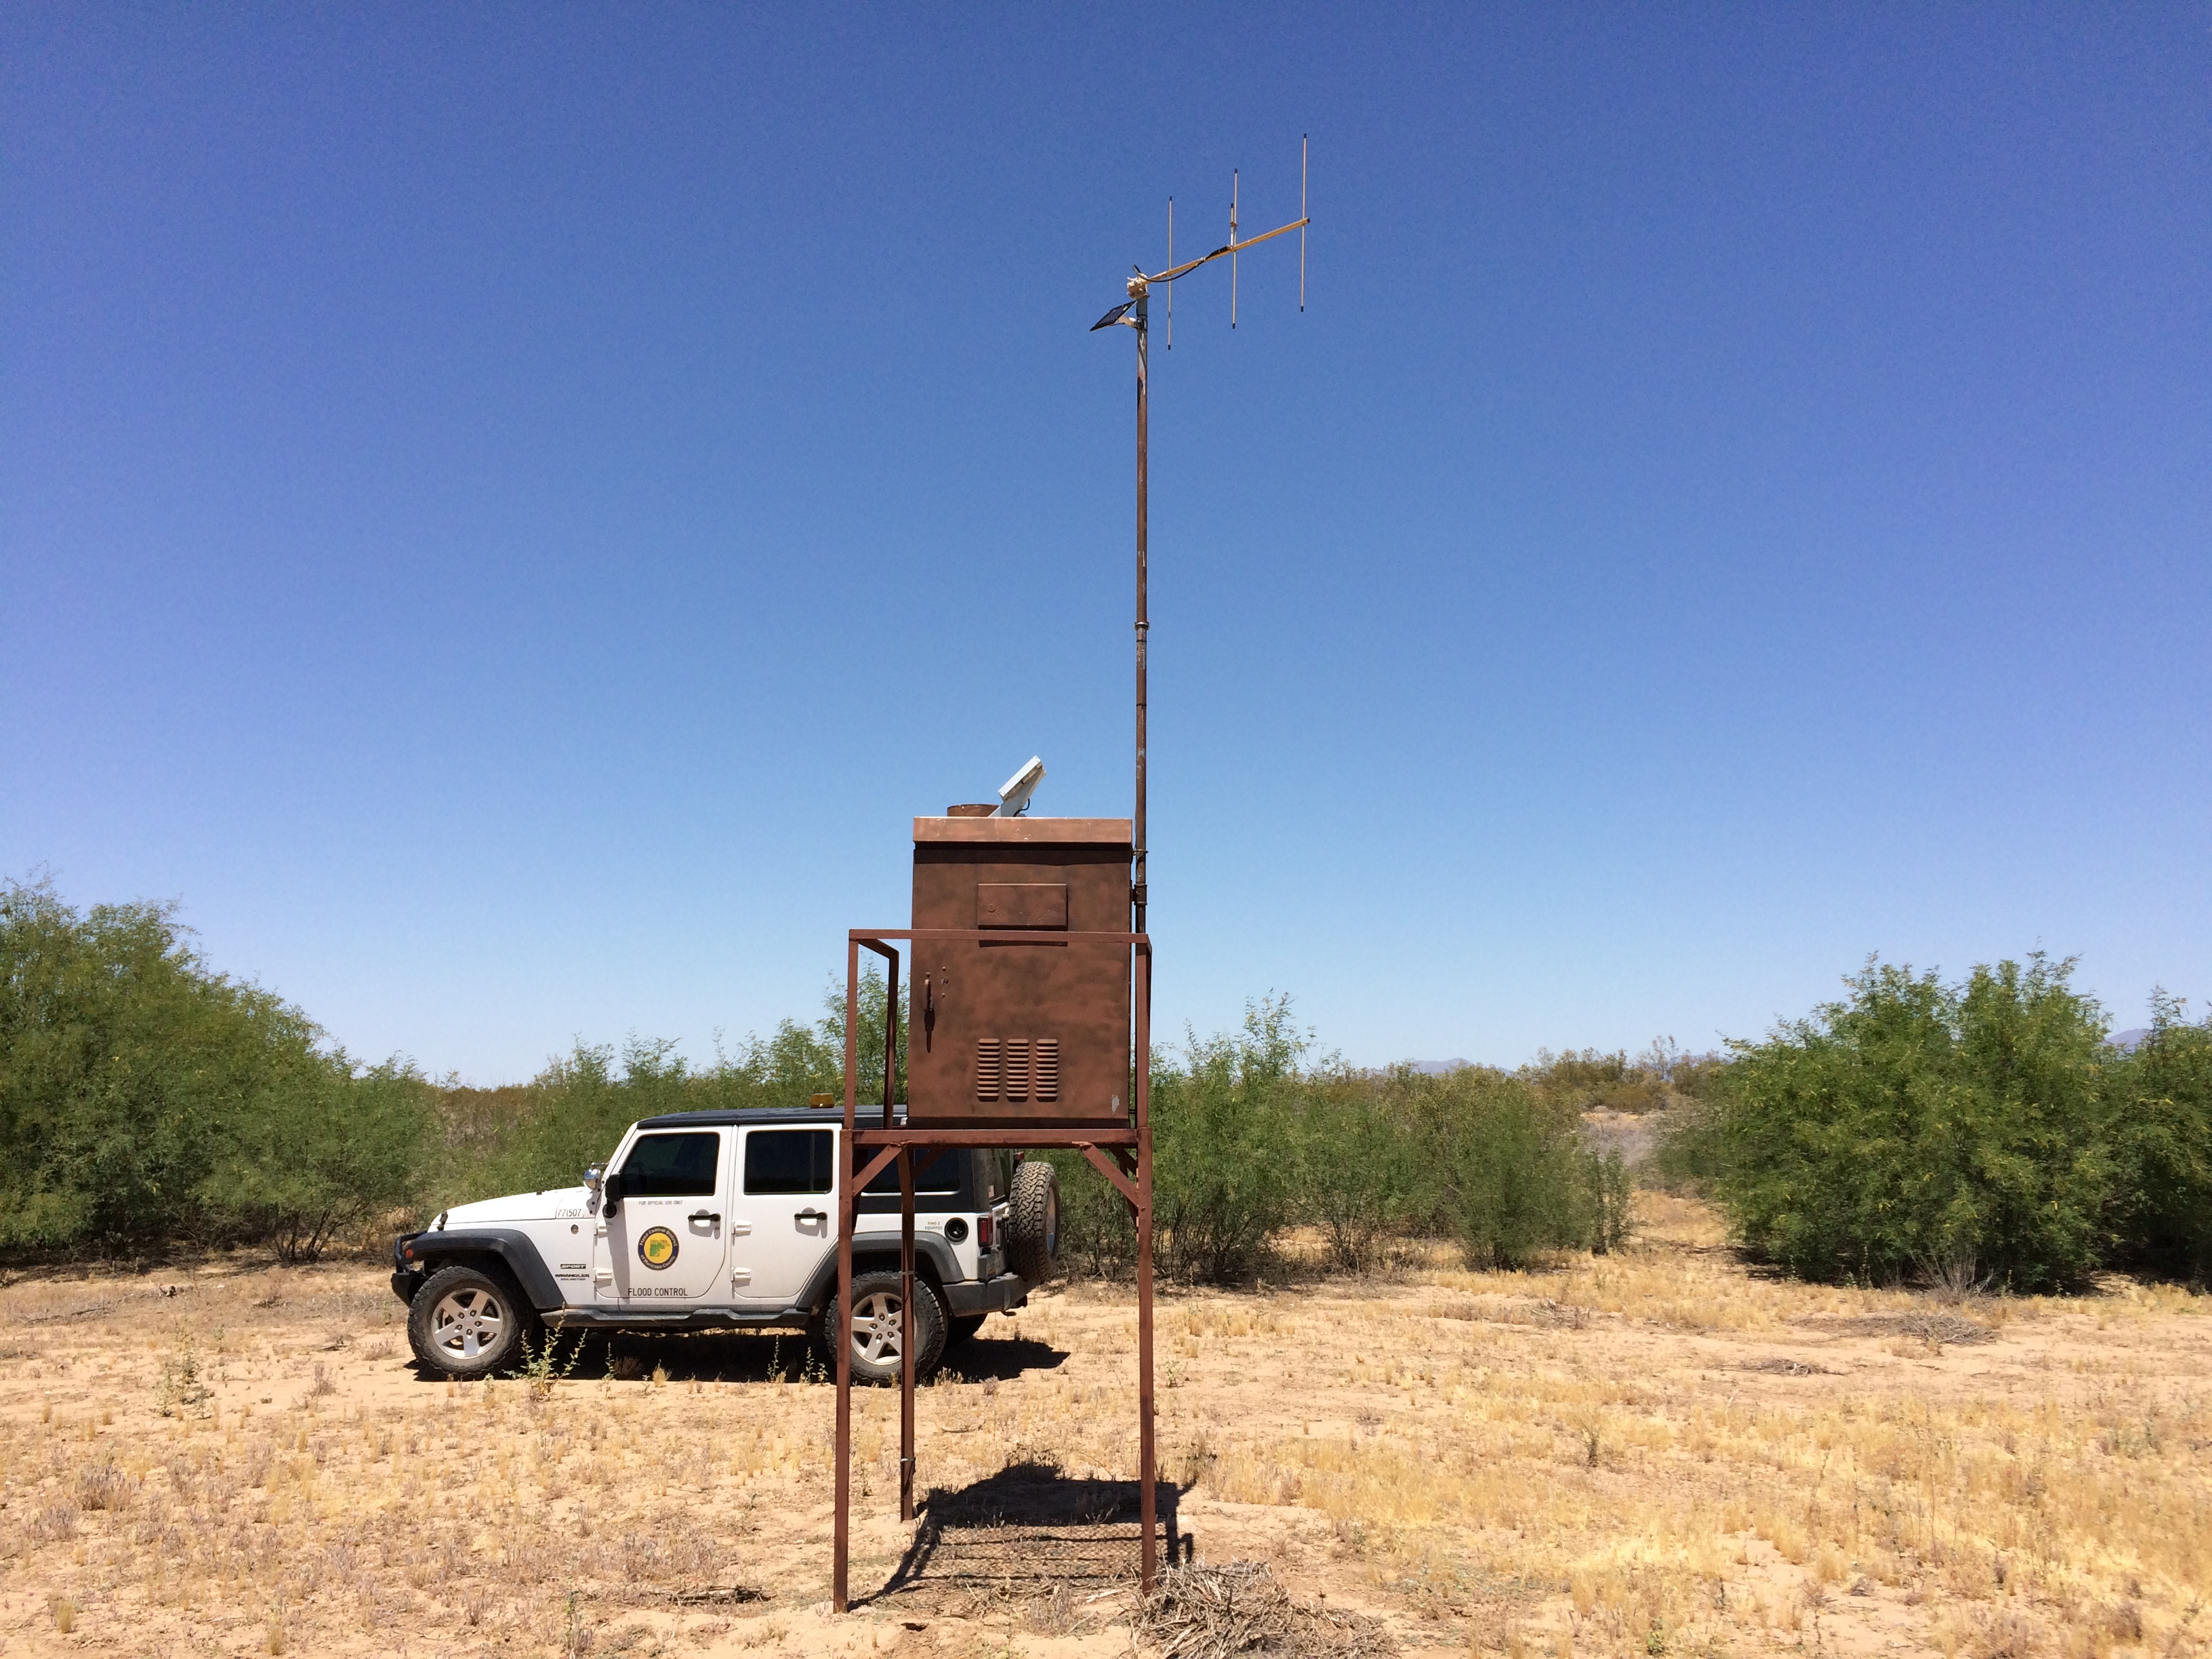
| STATUS | Active |
| LOCATION | Located in western Maricopa County, southwest of Salome Road and I-10 |
| DRAINAGE AREA | 20 mi2 (from USGS Streamstats) |
| STREAM TYPE | Levee on natural drainage |
| JURISDICTION | Maricopa County, Arizona |
| WATERSHED | Lower Centennial |
| SECTION/TOWNSHIP/RANGE | S17 T2N R10W |
| LATITUDE | N 33° 31' 09.9" | +33.51942 |
| LONGITUDE | W 113° 15' 37.8" | -113.26049 |
| ARIZONA STATE PLANE | E 290435 | N 919177 |
| USGS QUAD SHEET | Courthouse Well 7.5-Minute |
| STREAMGAGE INSTALLATION DATE | 07/09/2003 - WY 2003 |
| PERIOD OF AVAILABLE DATA RECORD | 07/09/2003 - Current |
| LENGTH OF AVAILABLE DATA RECORD (AS OF 10/01/2024) | 21.23 Years | 7,755 Days |
| GAPS (> 2 DAYS) IN RECORD | None |
| STAGE GAGE TYPE | Pressure Transducer |
| STAGE GAGE ELEVATION | 0.65 feet Gage Height |
| STAFF GAGES | 1 |
| CREST STAGE GAGES | 1 |
| ZERO GAGE HEIGHT ELEVATION | 1,260.701 feet NAVD88 |
| POINT OF ZERO FLOW | 0.3 feet Gage Height |
| EXTREME FOR PERIOD OF RECORD | 1,000 cfs | 4.50 feet | 09/09/2013 |
| Current Rating = #2 - Applied since 10/01/2019 | ||
| Discharge (cfs) |
Elevation feet, Gage Height |
Elevation feet, NAVD88 |
| 0 | 0.00 | 1,260.70 |
| 50 | 1.40 | 1,262.10 |
| 100 | 2.33 | 1,263.03 |
| 200 | 2.87 | 1,263.57 |
| 400 | 3.56 | 1,264.26 |
| 500 | 3.81 | 1,264.51 |
| 700 | 4.24 | 1,264.94 |
| 1,000 | 4.75 | 1,265.45 |
| 1,500 | 5.40 | 1,266.10 |
| Water Year |
Peak Gage Height (feet) |
Peak Discharge (cfs) |
Date of Peak |
| 2026 | |||
| 2025 | None | 0 | None |
| 2024 | 1.2 | 39 | 12/22/2023 |
| 2023 | 0.87 | 25 | 10/15/2022 |
| 2022 | 2.02 | 82 | 08/13/2022 |
| 2021 | None | 0 | None |
| 2020 | 1.05 | 33 | 08/30/2020 |
| 2019 | 3.37 | 430 | 09/24/2019 |
| 2018 | 1.46 | 39 | 07/09/2018 |
| 2017 | 1.78 | 69 | 07/16/2017 |
| 2016 | 2.52 | 192 | 10/20/2015 |
| 2015 | 4.24 | 840 | 09/07/2015 |
| 2014 | None | 0 | None |
| 2013 | 4.50 | 1,000 | 09/09/2013 |
| 2012 | 2.35 | 158 | 09/04/2012 |
| 2011 | None | 0 | None |
| 2010 | 2.70 | 233 | 01/21/2010 |
| 2009 | 1.40 | 35 | 11/27/2008 |
| 2008 | None | 0 | None |
| 2007 | 0.82 | 4 | 09/03/2007 |
| 2006 | None | 0 | None |
| 2005 | 1.15 | 20 | 01/04/2005 |
| 2004 | None | 0 | None |
| 2003 | 2.17 | 126 | 08/15/2003 |
| Date of Peak |
Time of Peak |
Runoff Start |
Runoff End |
Duration (hours) |
Peak Stage (feet GH) |
Peak Discharge (CFS) |
Water Year |
| View a Plot of These Data | |||||||
| 12/22/2023 | 20:00 | 12/22/2024 18:00 | 12/23/2023 12:00 | 18.0 | 1.20 | 39 | 2024 |
| 09/01/2023 | 13:45 | 09/01/2023 12:00 | 09/02/2023 00:00 | 12.0 | 0.85 | 24 | 2023 |
| 10/15/2022 | 15:18 | 10/15/2022 12:00 | 10/16/2022 12:00 | 24.0 | 0.87 | 25 | 2023 |
| 08/20/2022 | 06:00 | 08/20/2022 03:59 | 08/20/2022 18:00 | 14.0 | 0.90 | 27 | 2022 |
| 08/14/2022 | 12:00 | 08/14/2022 07:40 | 08/15/2022 06:00 | 22.3 | 0.90 | 27 | 2022 |
| 08/13/2022 | 00:00 | 08/12/2022 20:30 | 08/13/2022 14:54 | 18.4 | 2.02 | 82 | 2022 |
| 08/08/2022 | 09:31 | 08/08/2022 07:45 | 08/09/2022 06:00 | 22.3 | 1.75 | 67 | 2022 |
| 08/04/2022 | 12:00 | 08/04/2022 08:52 | 08/05/2022 06:00 | 21.1 | 1.87 | 73 | 2022 |
| 07/26/2022 | 00:48 | 07/25/2022 23:18 | 07/26/2022 12:00 | 12.7 | 1.60 | 59 | 2022 |
| 08/30/2020 | 19:26 | 08/30/2020 18:10 | 08/31/2020 01:47 | 7.6 | 1.05 | 33 | 2020 |
| 09/24/2019 | 00:32 | 09/23/2019 15:37 | 09/25/2019 03:53 | 36.3 | 3.37 | 430 | 2019 |
| 09/16/2019 | 21:35 | 09/16/2019 19:11 | 09/17/2019 03:28 | 8.3 | 1.45 | 39 | 2019 |
| 07/31/2019 | 00:26 | 07/30/2019 23:33 | 07/31/2019 08:19 | 8.8 | 1.17 | 21 | 2019 |
| 01/15/2019 | 18:54 | 01/15/2019 15:24 | 01/16/2019 05:54 | 14.5 | 1.77 | 68 | 2019 |
| 07/09/2018 | 22:04 | 07/09/2018 20:44 | 07/10/2018 07:02 | 10.3 | 1.46 | 39 | 2018 |
| 07/16/2017 | 00:00 | 07/15/2017 23:12 | 07/16/2017 18:00 | 18.8 | 1.78 | 69 | 2017 |
| 10/20/2015 | 13:07 | 10/20/2015 08:21 | 10/21/2015 17:33 | 33.2 | 2.52 | 192 | 2016 |
| 09/07/2015 | 22:19 | 09/07/2015 18:46 | 09/09/2015 06:00 | 35.2 | 4.24 | 840 | 2015 |
| 07/17/2015 | 22:06 | 07/17/2015 19:31 | 07/19/2015 00:00 | 28.5 | 2.57 | 202 | 2015 |
| 09/09/2013 | 17:33 | 09/09/2013 13:49 | 09/11/2013 08:30 | 42.7 | 4.50 | 1,000 | 2013 |
| 09/04/2012 | 22:22 | 09/04/2012 19:40 | 09/06/2012 00:18 | 28.6 | 2.35 | 158 | 2012 |
| 07/14/2012 | 21:03 | 07/14/2012 18:15 | 07/15/2012 11:33 | 17.3 | 2.00 | 99 | 2012 |
| 02/20/2010 | 18:43 | 02/20/2010 14:22 | 02/21/2010 11:12 | 20.8 | 1.75 | 66 | 2010 |
| 01/21/2010 | 11:02 | 01/21/2010 05:25 | 01/22/2010 16:34 | 35.2 | 2.70 | 233 | 2010 |
| 01/20/2010 | 00:42 | 01/19/2010 23:24 | 01/20/2010 12:42 | 13.3 | 1.10 | 17 | 2010 |
| 11/27/2008 | 03:34 | 11/27/2008 00:23 | 11/27/2008 14:31 | 14.1 | 1.40 | 35 | 2009 |
| 09/03/2007 | 18:02 | 09/03/2007 18:02 | single report | 0.0 | 0.82 | 4 | 2007 |
| 02/20/2005 | 13:13 | 02/20/2005 01:59 | 02/20/2005 15:57 | 14.0 | 0.82 | 4 | 2005 |
| 01/04/2005 | 06:44 | 01/04/2005 02:39 | 01/04/2005 15:55 | 13.3 | 1.15 | 20 | 2005 |
| 12/29/2004 | 15:55 | 12/29/2004 15:55 | single report | 0.0 | 0.72 | 1 | 2005 |
| 10/21/2004 | 15:51 | 10/21/2004 14:23 | 10/21/2004 21:51 | 7.5 | 0.80 | 4 | 2005 |
| 08/15/2003 | 04:00 | 08/14/2003 23:49 | 08/15/2003 17:57 | 18.1 | 2.17 | 126 | 2003 |
| 07/30/2003 | 04:01 | 07/30/2003 02:57 | 07/30/2003 12:48 | 9.9 | 1.02 | 13 | 2003 |
| Flood Flow Frequency View a plot of Flood Frequncy Data ***NOTE: Flood Flow Frequency data are for information only and should not be considered valid for regulation*** Magnitude and Probability of Instantaneous Peak Flow | Discharge, in cfs, for indicated Recurrence Interval |
|||||||
| USGS StreamStats Flood Flow Frequency | |||||||
| 2-year | 5-year | 10-year | 25-year | 50-year | 100-year | 200-year | 500-year |
| Flood Flow Frequency Based on HECWRC implementation of Bulletin 17B, n=19, 2003-2021 |
|||||||
| 2-year | 5-year | 10-year | 20-year | 50-year | 100-year | 200-year | 500-year |
| Staff Gage Range | Staff Gage Information |
| 0 - 10 | Located just downstream of the station platform |
| Crest Gage Number | Pin Elevation (Feet, Gage Height) |
Additional Information |
| 1 | 1.34 | Located on the gage platform at the channel center |