STORM REPORT
Summer/Autumn Storms of 2000
August 29th, October 10th, October 21st-23rd, October 27th
Flood Control District of Maricopa County
2801 W. Durango Street
Phoenix, AZ 85009
(602) 506-1501
Prepared by:
Stephen D. Waters, E. Jim Perfrement & David E. Gardner
Engineering Division, Flood Warning Branch
December, 2000
Revised : Feb. 1, 2001
Table of Contents
Appendix A: Selected Meteorological Services Program Outlooks
and Messages
Appendix B: Point Rainfall Maps and Isohyetal Rainfall Coverage Maps
from FCD Automated Gage Data
Appendix C: NEXRAD Reflectivity Images from Phoenix WFO
Appendix D: Depth/Duration/Frequency Plots and Histograms for Seven
Selected Stations
Appendix E: Selected Digital Photos
INTRODUCTION
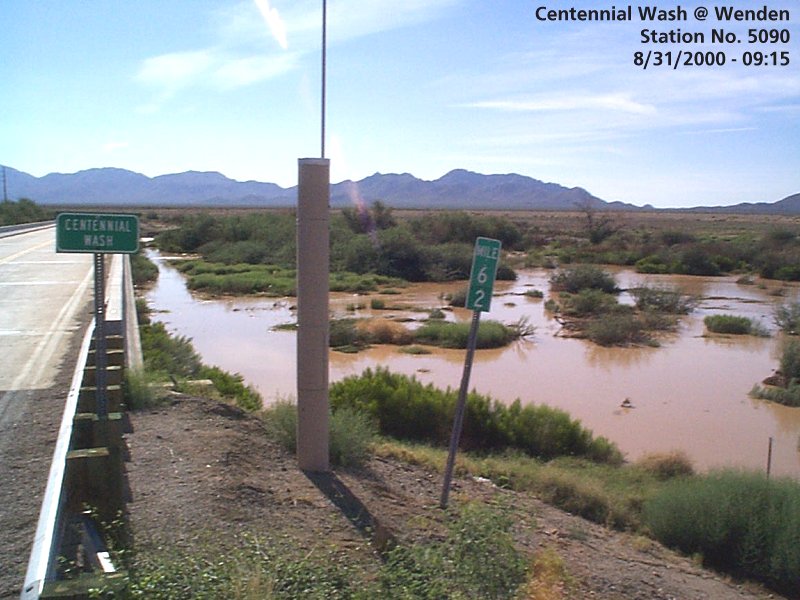
A number of heavy thunderstorms dropped large amounts of rain in the Wickenburg area, lower Hassayampa and upper Centennial watersheds on August 29th, 2000. These storms caused flooding along several watercourses in northwestern Maricopa County and eastern La Paz County, including Martinez Creek, Sols Wash and Centennial Wash.
The month of October featured a series of Pacific low-pressure frontal systems which tapped tropical moisture in northern Mexico as they passed through the State, resulting in heavy widespread rain with numerous embedded thunderstorms. Again, the Wickenburg and Centennial areas were affected, along with Grass Wash, Tiger Wash, Jackrabbit Wash and much of northern Maricopa County.
The purpose of this report is to present in a concise manner selected rainfall, runoff, graphical and statistical data from the storm events of August 29, October 10, October 21-23 and October 27, 2000. The majority of the data presented was collected by the Flood Control District's (FCD) ALERT System, with contributions from the Phoenix National Weather Service (NWS) Forecast Office and the United States Geological Survey (USGS) surface-water data collection program.
The goal of this report is to present data and derived products for general information purposes, and as a guide for future prediction of water levels and discharge rates in the watersheds affected by flooding.
DISCLAIMER: Although these data have been reviewed and/or edited they may be subject to significant change. Data users are cautioned to consider carefully the provisional nature of this information before using it for decisions that concern personal or public safety or the conduct of business that involves substantial monetary or operational consequences.
This report and the data contained within it, as well as the entire compliment of real-time and historic FCD ALERT data can be viewed or downloaded from our website at:
http://www.fcd.maricopa.gov/alert/alert.htm
Also, a Compact Disk containing this report and all associated tables and graphics can be ordered from the FCD at the address on the report cover page or by calling (602) 506-8701.
August 29,2000
On the 29th of October the atmosphere over central and southern Arizona was very moist, possibly the most moisture available for shower and thunderstorm development of any day during the 2000 monsoon season. As for a trigger (dynamics) to get storms going, there was a lower/mid level atmospheric disturbance forecast to move north/northwest through the state. Also, in the upper levels of the atmosphere, there was a disturbance off the California coast - aiding the import of moisture from the south, as well as acting as an additional trigger for storm development.
The precipitable water at 5 AM was 1.84 inches, the 850mb dewpoint was >14 degrees, and the 600mb dewpoint depression was <2 degrees - collectively a strong indicator of very moist air from the surface to over 15,000 feet altitude. The only concern, which could inhibit storm development, was existing cloud cover and relatively cool temperatures - but as it turned out these concerns didn't materialize.
A few showers and thunderstorms developed on the 28th, continued to develop and became stronger late that night and peaked on the morning of the 29th. Moisture at lower and middle levels of the atmosphere continued to be pumped into Maricopa County from the south (Mexico/Gulf of Mexico) through most of the day. Thus there was no drying of consequence following the initial outbreak of showers. To make matters worse, the storm moved at a relatively slow speed (mostly 12-15 mph), allowing locally heavy rain to remain over an area for a period of time. The storm center finally moved north of the County during the night of the 29th.
October 2000
A series of weather disturbances moved south/southeast from the northern Pacific (a pattern referred to as split flow) - for the extended period of mid October into November. Although this is not an overly unusual trend or general track, what was different was the extended period of time that was involved, the strength of the systems and the track's location so far south for the time-of-year (into Arizona). Normally only one or two of these disturbances will become moderately strong, but this time most resulted in periods of moderate to heavy rain for Maricopa County. As a result our (calendar) annual rain accumulation went from a deficit to above normal.
October 10, 2000
On the 9th of October weather maps showed a large upper-level atmospheric weather disturbance sliding south along the west coast. At lower and mid levels of the atmosphere moisture from the sub-tropics was advected north, via south to southeast winds, into Maricopa County. And lastly, there was a strong cold front moving east through southern California - located along a north-south line near the western border of Arizona the morning of the10th, moving east to roughly a Page to Blythe line by around noon.
This resulted in a moist atmosphere that was "triggered" by the approaching disturbance and associated cold front. The end result was short-lived, locally-heavy morning rain in the Phoenix area - which moved east and northeast with time.
Farther to the south, over northern Mexico, there were remnants of tropical storm Olivia, but it's doubtful that this system had much of an impact on what took place over Maricopa County. Most of the moisture associated with Olivia was advected eastward into New Mexico and Texas.
October 21- 23, 2000
To set the stage for this event a few showers and thunderstorms moved through Maricopa County on the 19th (Thursday). Local rain accumulations amounted to .25 to .50 inch. This rain was the result of the first in an extended series of upper level weather disturbances that moved south/southeast into our area during October/November.
It was dry on the 20th (Friday), as Maricopa County was between disturbances. But an approaching strong cold upper atmospheric weather disturbance (from the northwest) resulted in the development of scattered showers and thunderstorms Friday night and Saturday morning.
This Pacific storm had considerable moisture associated with it, and moved into an area that was already moist due to residual moisture associated with the disturbance that moved east across southern Arizona on the 19th.
Numerical guidance, as early as Wednesday (18th), suggested the threat of rain for the weekend. And by Friday guidance indicated the threat of heavy rain - to over an inch. With the Saturday "Weather Outlook" issued at 1:10 PM, clients were alerted to break out their Flood Response Plans and prepare for a significant rain event.
The heaviest and most destructive rains fell Saturday evening (21st) - with portions of western Maricopa County receiving over 3 inches of rain. Especially hard hit, as a result of the heavy rain, were Centennial Wash (flow into Wenden), Wickenburg (Sols Wash) and Skunk Creek.
The associated upper level disturbance was slow to leave the area. As a result additional rains fell Saturday night and Sunday, with the storm exiting to the north and east Sunday night and Monday. But the heaviest rains by Sunday (to over an inch) were over the east and northern fringes of the County - not the same area hit hard Saturday evening.
October 27, 2000
The major storm that took place October 21-23 left the soil very wet - possibly saturated in many areas. Thus additional rain would become mostly runoff. The weather disturbance that moved toward Maricopa County on the 26th and 27th, like previous disturbances, moved into the area from the northwest.
This weather disturbance had an unseasonably strong cold front associated with it. Wednesday morning the front was positioned north-south over far southeast California and eastern Nevada. By Wednesday evening the front was north-south through central Arizona. By Thursday morning (27th) it had dissipated east of the County, but a secondary front, or trough, developed back near the Arizona/California border. This latter feature was probably a significant trigger that aided development of the locally heavy rain that followed.
The advection of moisture from Mexico was probably not overly noteworthy, compared to the disturbance 5 days earlier, but as mentioned the ground was already very moist. And the upper level disturbance was very strong - resulting in good dynamics to act on the existing moisture.
Showers and thunderstorms moved into the area from the west, again hitting northwest Maricopa County with locally heavy rain. The main band of rain (north-south orientation) was very slow to move east. By late morning (27th) some areas west and southwest of Wickenburg reported rain accumulations of over an inch, and locally heavy rain remained in the general Wickenburg area into the afternoon hours.
During the afternoon the heaviest rains slowly moved east toward the central portion of the County. By late afternoon the heaviest rains were centered over the central portion of the County; and by evening the heaviest rains were over the far eastern portion of the County - as the associated weather disturbance started to move away from the area. But local showers persisted over much of the County through the evening.
Appendix A contains selected Outlook and Message Products from our Meteorological Services Program (MSP). The MSP provides heavy rainfall and severe weather forecast products to emergency management agencies, public works and transportation agencies, engineering departments, law enforcement, and fire departments and recreation departments within Maricopa County.
PRECIPITATION
A series of heavy thunderstorms dropped large amounts of rain in the Wickenburg area, lower Hassayampa and upper Centennial watersheds on August 29th, 2000. These storms caused flooding along several watercourses in northwestern Maricopa County and eastern La Paz County, including Martinez Creek, Sols Wash and Centennial Wash. Rain fell in general from 7:00 am through 2:00 PM.
The month of October featured consecutive Pacific low-pressure frontal systems which tapped tropical moisture in northern Mexico and the Gulf of California as they passed through the State, resulting in heavy widespread rain with numerous embedded thunderstorms. The heavy event periods were from 4:00 AM through 11:00 AM on the 10th, 7:00 PM on the 21st through 11:00 AM on the 22nd (with scattered showers on the 23rd), and 7:00 AM through 6:00 PM on the 27th. Again, the Wickenburg and Centennial areas were affected, along with Grass Wash, Tiger Wash, Jackrabbit Wash and much of northern Maricopa County, including Skunk Creek, New River and Cave Creek.
The following Table 1 lists selected frequency statistics at seven automated ALERT Stations:
|
Gage ID |
Gage Name |
Storm Date |
Depth (inches) |
Duration (hours) |
Return Period / Duration |
|
7030 |
Sols Tank |
8/29/00 |
3.50 |
12 |
60 yr - 12 hr. |
|
5275 |
Sols Wash |
8/29/00 |
4.61 |
12 |
>100 yr - 12 hr. |
|
4930 |
Carefree Ranch |
10/22/00 |
2.09 |
24 |
2 yr - 24 hr. |
|
7120 |
Wickenburg Airport |
10/22/00 |
2.87 |
2 |
100 yr - 2 hr. |
|
5190 |
Smith Peak |
10/22/00 |
3.27 |
24 |
30 yr - 6 hr. |
|
5640 |
Cooks Mesa |
10/22/00 |
3.98 |
24 |
40 yr - 12 hr. |
|
5180 |
Centennial Wash |
10/27/00 |
2.56 |
6 |
30 yr - 6 hr. |
For general locations of these gages and the graphs used to create this table, see Appendix D
Appendix B contains four pages showing two graphics for each storm. The first is a map of the County showing point rainfall totals measured by the ALERT automated gages. The rainfall period and ending time are shown at the bottom. The second graphic is a contoured rainfall map using the point values from the first map. It covers the same time period but may focus on areas of interest.
Appendix C contains several NEXRAD radar images from the storms in 1-hour, 3-hour and Storm Total formats, courtesy of Phoenix WFO. Appendix D displays depth/duration/frequency plots and histograms for seven selected stations. Additional detailed rainfall information is available on the web at: http://alert.fcd.maricopa.gov/showrain.html or http://alert.fcd.maricopa.gov/alert/raindata.html.
RUNOFF
The storm of August 29th featured significant runoff events in the Wickenburg area and in the Centennial watershed. Flows in these areas had estimated return periods of between 8 and 17 years.
On October 10th, flows in central Phoenix and Scottsdale were generally around a 2-year return period. But the rains from this storms served to wet many watersheds around the County, which added to the runoff potential for subsequent storms.
October 27th saw heavy runoff in the northern, central, western and northwestern portions of the County. Centennial Wash experienced what is believed to be a 100-year event, Sols Wash saw a 66-year return period event, Flying E Wash in Wickenburg around a 40, and Hartman and Tiger Washes approximately 16-year events.
Flows during the October 27th storm were again heavy in the western and northwestern parts of the County. Jackrabbit Wash experienced a 50-year flood, Hassayampa @ I-10 recorded a 70-year event, Casandro Wash in Wickenburg suffered a 40-year, and Sols Wash and Tiger Wash each were deluged by 10-year events.
Table 2 on the following page lists significant discharge peaks and return periods for selected FCD stream gages. Table 3 presents peak stage and discharge values at all FCD water-level stations. Following Table 3 are three selected hydrograph plots showing travel and warning times.
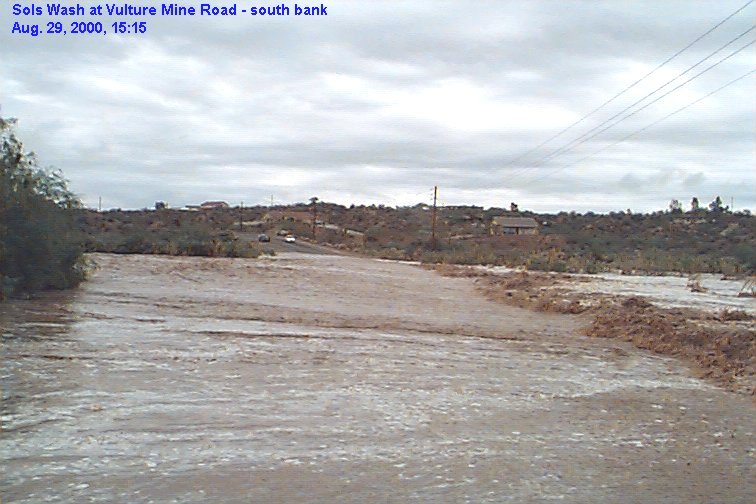
TABLE 2
Significant Discharge Peaks and Return Periods for Automated ALERT Stream Gages
|
GAGE |
GAGE |
STORM |
PEAK |
RETURN |
|
NAME |
ID |
DATE |
DISCHARGE (cfs) |
PERIOD (years) |
|
|
|
|
|
|
|
Centennial @ Wenden |
5093 |
08/29/00 |
4,850 |
10 (a) |
|
Hassayampa @ US 60 |
5228 |
08/29/00 |
5,625 |
8 % of Q100 (a) |
|
Martinez Creek |
7013 |
08/29/00 |
7,270 |
8 (a) |
|
Powderhouse Wash |
7113 |
08/29/00 |
515 |
17 (a) |
|
Sols Wash nr Matthie |
7043 |
08/29/00 |
5,240 |
13 (a) |
|
|
|
|
|
|
|
ACDC @ 43rd Ave. |
4821 |
10/10/00 |
395 |
< 2 (b) |
|
ACDC @ 67th Ave. |
5523 |
10/10/00 |
375 |
< 2 (b) |
|
Berneil Wash |
4688 |
10/10/00 |
305 |
15 % of Design Q |
|
EMF @ Broadway |
6573 |
10/10/00 |
504 |
14 % of Q100 (a) |
|
IBW @ Shea Blvd. |
4693 |
10/10/00 |
1,250 |
14 % of Q100 (a) |
|
|
|
|
|
|
|
ACDC @ 43rd Ave. |
4821 |
10/21-23/00 |
360 |
< 2 (b) |
|
Adobe Dam Outflow |
5538 |
10/21-23/00 |
497 |
NA |
|
Bullard Wash |
6863 |
10/21-23/00 |
250 |
NA |
|
Cave Buttes Dam Outflow |
4899 |
10/21-23/00 |
206 |
NA |
|
Centennial @ Wenden |
5093 |
10/21-23/00 |
24,250 |
~ 100 (a) |
|
Delaney Wash |
5108 |
10/21-23/00 |
260 |
NA |
|
EMF @ Queen Creek Rd. |
6583 |
10/21-23/00 |
574 |
NA |
|
Flying E Wash |
7083 |
10/21-23/00 |
3,675 |
40 (a) |
|
Greene Wash @ SR 84 |
0793 |
10/21-23/00 |
1,155 |
NA |
|
Hartman Wash |
7063 |
10/21-23/00 |
2,350 |
16 (c) |
|
Hassayampa @ US 60 |
5228 |
10/21-23/00 |
15,400 |
22 % of Q100 (a) |
|
Hassayampa nr Morristown |
5223 |
10/21-23/00 |
5,240 |
3 (c) |
|
Martinez Creek |
7013 |
10/21-23/00 |
890 |
< 2 (a) |
|
New River Dam Outflow |
5609 |
10/21-23/00 |
440 |
NA |
|
Powderhouse Wash |
7113 |
10/21-23/00 |
350 |
12 (a) |
|
Santa Cruz @ SR 84 |
0788 |
10/21-23/00 |
1,260 |
NA |
|
Skunk Creek @ I-17 |
5568 |
10/21-23/00 |
2,320 |
4 (c) |
|
Sols Wash nr Matthie |
7043 |
10/21-23/00 |
10,800 |
66 (a) |
|
Tiger Wash |
5163 |
10/21-23/00 |
3,850 |
16 (c) |
|
Waterman Wash |
6833 |
10/21-23/00 |
1,980 |
~7 % of Q100 (a) |
|
|
|
|
|
|
|
ACDC @ 43rd Ave. |
4821 |
10/27/00 |
880 |
< 2 (b) |
|
Agua Fria @ Grand Ave. |
5503 |
10/27/00 |
5,839 |
NA |
|
Casandro Wash |
7093 |
10/27/00 |
400 |
46 (a) |
|
Centennial @ Wenden |
5093 |
10/27/00 |
11,150 |
28 (a) |
|
EMF @ Queen Creek |
6583 |
10/27/00 |
2,460 |
NA |
|
Gila River @ Olberg |
0783 |
10/27/00 |
2,590 |
< 2 (a) |
|
Hartman Wash |
7063 |
10/27/00 |
1,050 |
6 (c) |
|
Hassy @ Box Canyon |
5308 |
10/27/00 |
3,215 |
2 (c) |
|
Hassayampa @ I-10 |
5283 |
10/27/00 |
40,800 |
70 (a) |
|
Hassayampa @ US 60 |
5228 |
10/27/00 |
8,070 |
12 % of Q100 (a) |
|
Jackrabbit Wash |
5218 |
10/27/00 |
32,400 |
> 100 (c) |
|
Martinez Creek |
7013 |
10/27/00 |
2,650 |
4 (a) |
|
New River @ Glendale |
5508 |
10/27/00 |
2,450 |
< 2 (a) |
|
Scatter Wash |
5543 |
10/27/00 |
490 |
9 (a) |
|
Skunk Creek @ I-17 |
5568 |
10/27/00 |
480 |
< 2 (c) |
|
Sols Wash nr Matthie |
7043 |
10/27/00 |
4,760 |
10 (a) |
|
Tiger Wash |
5163 |
10/27/00 |
3,170 |
10 (a) |
"Q" refers to discharge; Q100 is the 100-year or Regulatory Discharge
(a) - Return period estimated from Flood Insurance Study rainfall/runoff modeling
(b) - Return period estimated from structure design report
(c) - Return period estimated from streamflow data recorded prior to these storms
NA - Not Available
Values in Blue are computed from and/or verified by slope/area survey computations and/or high-water marks. Values in Green are provided by USGS. Values in Red are added or changed in the 02/01/2001 revision.
To find the location of an ALERT water-level station, point your browser to http://www.fcd.maricopa.gov/alert/alert.htm and use the "Station Location Maps" tool. Additional stage and discharge information is available on the web at: http://alert.fcd.maricopa.gov/showflow.html
TABLE 3 - Peak Stage and Discharge Values at FCDMC Water-level Stations
|
GAGE_ID |
NAME |
PEAKS |
|||||||
|
10/27/00 |
10/27/00 |
10/22/00 |
10/22/00 |
10/10/00 |
10/10/00 |
8/29/00 |
8/29/00 |
||
|
Q |
Stage |
Q |
Stage |
Q |
Stage |
Q |
Stage |
||
|
4818 |
10th St. Wash Basin #1 |
9 |
1.40 |
17 |
2.10 |
0 |
0.00 |
1 |
0.50 |
|
4813 |
ACDC @ 14th St. |
27 |
0.70 |
0 |
0.00 |
0 |
0.00 |
0 |
0.00 |
|
4808 |
ACDC @ 36th St. |
7 |
1.02 |
3 |
0.47 |
3 |
0.47 |
0 |
0.00 |
|
4821 |
ACDC @ 43rd Ave. |
880 |
2.25 |
360 |
1.44 |
395 |
1.51 |
0 |
0.00 |
|
5523 |
ACDC @ 67th Ave. |
417 |
3.42 |
271 |
2.95 |
375 |
3.30 |
81 |
1.90 |
|
5538 |
Adobe Dam Outlet |
154 |
2.45 |
497 |
4.45 |
0 |
0.00 |
0 |
0.00 |
|
5534 |
Adobe Dam Pool |
196 |
4.58 |
419 |
8.20 |
0 |
0.00 |
0 |
0.00 |
|
5403 |
Agua Fria @ Buckeye |
1,288 |
0.15 |
433 |
-0.38 |
433 |
-0.38 |
0 |
0.00 |
|
5503 |
Agua Fria @ Grand |
5,839 |
6.46 |
10 |
2.95 |
0 |
0.00 |
0 |
0.00 |
|
6673 |
Apache Junction FRS |
26 |
4.23 |
25 |
3.98 |
0 |
0.00 |
0 |
0.00 |
|
5988 |
Aspen Dam |
36 |
2.28 |
7 |
0.66 |
10 |
0.86 |
0 |
0.00 |
|
4688 |
Berneil Wash |
100 |
0.70 |
297 |
1.35 |
305 |
1.38 |
46 |
0.43 |
|
5203 |
Buckeye FRS #1 |
0 |
0.00 |
0 |
0.00 |
0 |
0.00 |
0 |
0.00 |
|
5208 |
Buckeye FRS #2 |
0 |
0.00 |
0 |
0.00 |
0 |
0.00 |
0 |
0.00 |
|
6813 |
Buckeye FRS #3 |
0 |
0.00 |
0 |
0.00 |
0 |
0.00 |
0 |
0.00 |
|
6863 |
Bullard Wash |
243 |
1.04 |
250 |
1.01 |
0 |
0.00 |
0 |
0.00 |
|
7133 |
Casandro Dam |
15 |
7.22 |
14 |
5.27 |
0 |
0.00 |
13 |
4.29 |
|
7093 |
Casandro Wash |
400 |
1.20 |
74 |
0.82 |
0 |
0.00 |
147 |
1.42 |
|
4903 |
Cave Buttes Dam Outlet |
21 |
1.60 |
29 |
1.80 |
31 |
1.87 |
0 |
0.00 |
|
4899 |
Cave Buttes Dam Pool |
163 |
10.49 |
206 |
18.56 |
0 |
0.00 |
0 |
0.00 |
|
4918 |
Cave Cr. nr Cave Cr. |
221 |
1.10 |
590 |
2.12 |
0 |
0.00 |
0 |
0.00 |
|
4923 |
Cave Cr. @ Spur Cross |
180 |
4.33 |
635 |
5.83 |
0 |
0.00 |
0 |
0.00 |
|
4833 |
Cave Cr. @ Cactus |
222 |
8.58 |
386 |
10.33 |
138 |
4.76 |
62 |
2.70 |
|
5093 |
Centennial @ Wenden |
11,150 |
5.68 |
24,250 |
7.82 |
0 |
0.00 |
4,850 |
3.92 |
|
5103 |
Centennial Railroad |
0 |
0.00 |
180 |
3.10 |
0 |
0.00 |
0 |
0.00 |
|
5408 |
Colter @ El Mirage |
135 |
1.45 |
31 |
0.60 |
0 |
0.00 |
0 |
0.00 |
|
5013 |
Columbus Wash |
0 |
0.00 |
0 |
0.00 |
0 |
0.00 |
0 |
0.00 |
|
6623 |
Crossroads Park |
0 |
0.00 |
0 |
0.00 |
0 |
0.00 |
0 |
0.00 |
|
5108 |
Delaney Wash |
98 |
2.04 |
260 |
2.77 |
203 |
2.52 |
32 |
1.48 |
|
4803 |
Dreamy Draw Dam |
22 |
1.98 |
0 |
0.00 |
51 |
3.44 |
0 |
0.00 |
|
5422 |
Dysart @ El Mirage |
311 |
3.18 |
92 |
1.62 |
4 |
0.28 |
0 |
0.00 |
|
5413 |
Dysart @ LAFB |
113 |
1.47 |
19 |
0.55 |
0 |
0.00 |
0 |
0.00 |
|
4648 |
E. Fork Cave Cr. #1 |
0 |
0.00 |
0 |
0.00 |
0 |
0.00 |
4 |
0.57 |
|
4683 |
E. Fork Cave Cr. #3 |
0 |
0.00 |
0 |
0.00 |
14 |
0.45 |
28 |
0.95 |
|
4658 |
E. Fork Cave Cr. #4 |
21 |
1.58 |
14 |
1.17 |
41 |
2.58 |
56 |
3.15 |
|
4668 |
EFCC nr 7th Ave. |
15 |
0.40 |
15 |
0.40 |
116 |
1.62 |
94 |
1.42 |
|
6598 |
EMF @ AZ Ave. |
1,025 |
1.85 |
198 |
0.65 |
0 |
0.00 |
0 |
0.00 |
|
6573 |
EMF @ Broadway |
650 |
1.87 |
80 |
0.75 |
504 |
1.62 |
0 |
0.00 |
|
6583 |
EMF @ Queen Cr. |
2,460 |
3.80 |
574 |
1.65 |
0 |
0.00 |
144 |
0.68 |
|
6893 |
Estrella Fan |
0 |
0.00 |
0 |
0.00 |
0 |
0.00 |
0 |
0.00 |
|
7083 |
Flying E Wash |
263 |
1.75 |
3,675 |
5.60 |
0 |
0.00 |
211 |
1.55 |
|
6608 |
Freestone Basin |
0 |
1.23 |
0 |
1.25 |
0 |
0.00 |
0 |
4.68 |
|
6853 |
Gila @ Estrella Pkwy. |
1,900 |
6.95 |
1,500 |
6.60 |
0 |
0.00 |
0 |
0.00 |
|
778 |
Gila @ Maricopa Rd. |
71 |
2.04 |
0 |
0.00 |
0 |
0.00 |
0 |
0.00 |
|
783 |
Gila @ Olberg |
2,590 |
3.40 |
980 |
1.67 |
0 |
0.00 |
106 |
0.60 |
|
6848 |
Gila @ 116th Ave. |
0 |
0.00 |
0 |
0.00 |
0 |
0.00 |
0 |
0.00 |
|
5978 |
Golden Eagle Park Dam |
136 |
6.52 |
28 |
5.52 |
39 |
5.66 |
0 |
0.00 |
|
793 |
Greene Wash @ SR 84 |
80 |
0.52 |
1,155 |
3.28 |
0 |
0.00 |
0 |
0.00 |
|
6603 |
Guadalupe Channel |
526 |
1.98 |
235 |
1.25 |
0 |
0.00 |
0 |
0.00 |
|
6503 |
Guadalupe FRS |
0 |
0.00 |
0 |
4.07 |
0 |
0.00 |
0 |
0.00 |
|
5128 |
Harquahala FRS |
375 |
22.80 |
0 |
0.87 |
0 |
0.00 |
0 |
0.00 |
|
7063 |
Hartman Wash |
1,050 |
3.68 |
2,350 |
6.16 |
0 |
0.00 |
313 |
1.58 |
|
5228 |
Hassayampa @ US 60 |
15,400 |
4.90 |
0 |
0.00 |
0 |
0.00 |
5,625 |
2.90 |
|
5308 |
Hassy @ Box Canyon |
3,215 |
7.20 |
1,020 |
4.93 |
0 |
0.00 |
636 |
4.33 |
|
5283 |
Hassayampa @ I-10 |
40,800 |
7.05 |
0 |
0.00 |
0 |
0.00 |
0 |
0.00 |
|
5353 |
Hassy @ Wagoner Rd. |
39 |
3.84 |
156 |
4.66 |
0 |
0.00 |
13 |
3.31 |
|
5223 |
Hassy @ Morristown |
7,030 |
11.73 |
5,240 |
11.10 |
0 |
0.00 |
1,310 |
10.90 |
|
5993 |
Hesperus Dam |
45 |
3.09 |
0 |
0.00 |
0 |
0.00 |
0 |
0.00 |
|
4613 |
IBW @ Indian Bend Rd. |
211 |
2.00 |
177 |
1.83 |
238 |
2.12 |
14 |
0.50 |
|
4618 |
IBW @ Indian School |
239 |
2.56 |
253 |
2.59 |
267 |
2.62 |
0 |
0.00 |
|
4628 |
IBW @ McDonald |
485 |
0.95 |
412 |
0.90 |
511 |
0.98 |
0 |
0.00 |
|
4603 |
IBW @ McKellips |
210 |
1.42 |
114 |
1.15 |
190 |
1.38 |
0 |
0.00 |
|
4693 |
IBW @ Shea Blvd. |
200 |
1.25 |
200 |
1.25 |
1,250 |
2.50 |
142 |
1.10 |
|
4643 |
IBW @ Sweetwater |
292 |
2.00 |
271 |
1.91 |
924 |
3.69 |
241 |
1.77 |
|
4623 |
Interceptor Channel IBW |
37 |
0.60 |
65 |
0.98 |
5 |
0.12 |
0 |
0.00 |
|
5218 |
Jackrabbit Wash |
32,400 |
8.50 |
0 |
0.00 |
0 |
0.00 |
0 |
0.00 |
|
4678 |
Lake Marguarite |
160 |
1.30 |
195 |
1.52 |
160 |
1.30 |
0 |
0.00 |
|
7013 |
Martinez Creek |
2,650 |
6.30 |
890 |
4.00 |
0 |
0.00 |
7,270 |
8.32 |
|
5448 |
McMicken Dam |
0 |
0.60 |
0 |
0.00 |
0 |
0.00 |
0 |
0.00 |
|
5438 |
McMicken Floodway |
8 |
0.35 |
5 |
0.20 |
0 |
0.00 |
0 |
0.00 |
|
5598 |
New River @ Bell |
430 |
1.05 |
396 |
1.00 |
0 |
0.00 |
0 |
0.00 |
|
5613 |
New River Dam Outlet |
411 |
5.82 |
390 |
5.72 |
0 |
0.00 |
0 |
0.00 |
|
5609 |
New River Dam Pool |
440 |
6.70 |
440 |
6.70 |
0 |
0.00 |
0 |
0.00 |
|
5508 |
New River @ Glendale |
2,450 |
2.11 |
420 |
1.30 |
209 |
1.20 |
0 |
0.00 |
|
5983 |
North Heights Dam |
0 |
0.00 |
0 |
0.00 |
0 |
0.00 |
0 |
0.00 |
|
4748 |
Old Crosscut @ McDowell |
78 |
0.61 |
68 |
0.53 |
71 |
0.56 |
0 |
0.00 |
|
7113 |
Powderhouse Wash |
760 |
1.50 |
350 |
1.02 |
0 |
0.00 |
515 |
1.23 |
|
6683 |
Powerline FRS |
32 |
2.67 |
29 |
2.50 |
5 |
0.73 |
5 |
0.68 |
|
6707 |
Queen Cr. @ Rittenhouse |
0 |
0.00 |
0 |
0.00 |
0 |
0.00 |
0 |
0.00 |
|
6723 |
Queen Cr. @ CAP |
445 |
4.60 |
454 |
4.65 |
0 |
0.00 |
198 |
3.08 |
|
4863 |
Rawhide Wash |
0 |
0.00 |
0 |
0.00 |
70 |
1.00 |
0 |
0.00 |
|
6703 |
Rittenhouse FRS |
85 |
6.83 |
89 |
7.38 |
9 |
1.23 |
27 |
2.40 |
|
5113 |
Saddleback FRS |
47 |
1.00 |
29 |
0.60 |
0 |
0.00 |
0 |
0.00 |
|
4523 |
Salt River @ Priest |
1,220 |
3.38 |
1,785 |
3.62 |
0 |
0.00 |
0 |
0.00 |
|
788 |
Santa Cruz @ SR 84 |
200 |
2.03 |
1,260 |
3.90 |
0 |
0.00 |
84 |
1.38 |
|
798 |
Santa Rosa @ SR 84 |
0 |
0.00 |
575 |
0.41 |
0 |
0.00 |
0 |
0.00 |
|
6923 |
Sauceda Wash |
0 |
0.00 |
0 |
0.00 |
0 |
0.00 |
0 |
0.00 |
|
5543 |
Scatter Wash |
490 |
1.33 |
83 |
0.50 |
28 |
0.40 |
255 |
0.90 |
|
6628 |
Signal Butte FRS |
0 |
0.00 |
0 |
0.00 |
0 |
0.00 |
0 |
0.00 |
|
5583 |
Skunk Cr. nr New River |
172 |
2.00 |
687 |
3.50 |
0 |
0.00 |
0 |
0.00 |
|
5568 |
Skunk Cr. @ I-17 |
480 |
2.16 |
2,320 |
3.37 |
0 |
0.00 |
0 |
0.00 |
|
7043 |
Sols Wash nr Matthie |
4,760 |
3.22 |
10,800 |
5.15 |
0 |
0.00 |
5,240 |
3.40 |
|
6563 |
South Mtn. Fan |
14 |
0.38 |
0 |
0.00 |
14 |
0.38 |
0 |
0.00 |
|
4563 |
Spookhill FRS |
43 |
6.26 |
32 |
4.44 |
36 |
5.04 |
0 |
0.00 |
|
5968 |
Stone Ridge Dam |
39 |
4.43 |
0 |
0.75 |
0 |
0.75 |
0 |
0.00 |
|
5973 |
Sun Ridge Canyon Dam |
28 |
1.95 |
0 |
0.00 |
0 |
0.00 |
0 |
0.00 |
|
5248 |
Sunnycove FRS |
38 |
15.16 |
29 |
6.51 |
0 |
0.00 |
34 |
10.63 |
|
5233 |
Sunset FRS |
25 |
8.43 |
23 |
7.03 |
0 |
0.00 |
24 |
7.78 |
|
4638 |
Tatum Basin Inflow |
8 |
0.20 |
0 |
0.00 |
0 |
0.00 |
0 |
0.00 |
|
4653 |
Tatum Basin Outflow |
0 |
0.00 |
0 |
0.00 |
0 |
0.00 |
0 |
0.00 |
|
773 |
Tat Momolikot Dam |
0 |
4.01 |
0 |
0.00 |
0 |
0.00 |
0 |
4.53 |
|
5163 |
Tiger Wash |
3,170 |
7.40 |
3,850 |
7.84 |
0 |
0.00 |
0 |
0.00 |
|
6983 |
Vekol Wash |
0 |
0.00 |
0 |
0.00 |
0 |
0.00 |
0 |
0.00 |
|
6688 |
Vineyard FRS |
61 |
3.40 |
20 |
1.85 |
0 |
0.00 |
6 |
0.93 |
|
6833 |
Waterman @ Rainbow |
130 |
3.08 |
1,980 |
8.77 |
0 |
0.00 |
0 |
0.00 |
|
5418 |
White Tank FRS #3 |
0 |
0.00 |
0 |
0.00 |
0 |
0.00 |
0 |
0.00 |
|
6823 |
White Tank FRS #4 |
0 |
0.00 |
0 |
0.00 |
0 |
0.00 |
0 |
0.00 |
|
6739 |
Whitlow Ranch Dam |
0 |
0.00 |
0 |
0.00 |
0 |
0.00 |
0 |
0.00 |
|
5118 |
Winters Wash |
44 |
0.92 |
0 |
0.00 |
0 |
0.00 |
0 |
0.00 |
|
Values in BLUE are computed from slope/area survey computations and/or high-water marks |
|||||||||
|
Values in Red are added or changed in the 02/01/2001 revision. |
|||||||||
|
Values in GREEN are provided by USGS |
This graph shows the Sols Wash runoff event of August 29th (navy), along with rainfall from the Sols Tank raingage (magenta). Note the time-to-peak is around 3 hours and that a warning was issued approximately 2 hours before the peak flow reached downtown Wickenburg. This runoff event had a discharge peak of 5,240 cfs which translates to a return period of approximately 13 years.
This graph shows the Sols Wash runoff event of 10/21(navy), along with rainfall from the Sols Wash raingage (magenta). Note here that the time-to-peak is only 30 minutes, and that a warning was issued approximately 1 hour before the peak flow reached downtown Wickenburg. This runoff event had a discharge peak of 10,800 cfs which translates to a return period of approximately 66 years.
This graph shows the Centennial Wash runoff event of 10/22. Note here that the time-to-peak is 7 hours, and that a warning was issued approximately 4 hours before the peak flow reached Wenden. This runoff event had a discharge peak of approximately 22,000 cfs which translates to a return period of around 100 years.
ALERT SYSTEM PERFORMANCE
During the storms of August 29th through October 27th, 2000 the FCD ALERT System consisted of approximately 238 automated rain sensors and 106 automated water-level sensors.
On the August 29th storm only one rain/water-level station failed to operate - Agua Fria @ Buckeye Road.
The October 10th storm saw two rain/water-level stations fail due to lightning strikes - ACDC at 14th Street and ACDC @ 36th Street. Sunset Dam rain/water-level station was down because of a failed battery. The IBW @ McKellips Rd. and Hesperus Dam raingages did not operate properly because of plugged funnels. The Delaney Wash and Flying E Tank raingages were down because of programming errors, and the Buckeye @ 547th Ave. and Freestone Basin raingages were down for unknown reasons.
On October 19th a lightning strike hit a power pole across the street from the FCD office building, sending a surge across data and phone lines which destroyed four modems and two multi-port boards. As a result the ALERT base station was down from approximately 08:45 through 11:30. Steps are being taken to make sure this does not happen in the future.
The storm of October 21st-23rd saw inaccurate readings from the water-level sensors at Flying E and Hartman Washes, but did not hamper the generation of warnings for these areas. The Pinacle Peak Vista raingage was down due to transmitter failure, and the ASU South raingage was down due to battery failure. The IBW @ McKellips raingage was still inoperative because of a plugged funnel.
On October 27th the Hartman and Flying E Wash gages were still sending inaccurate data, and IBW @ McKellips raingage still had a plugged funnel, but all other stations worked properly.
The following Table (4) lists most of warnings and information disseminated during the storms by FCD ALERT personnel. We were unable to log all of the warnings for various reasons, and are working to resolve this for future event logs.
TABLE 4
|
Date_Time |
Agency |
Message Description |
|
8/29/00 10:00 AM |
Wickenburg Police Dispatch |
Martinez creek has substantial flow, expect a large flow on Sols Wash in 30-45 minutes. |
|
8/29/00 12:41 PM |
MCDOT Radio Room |
Hassayampa may get going enough later to warrant closing Patton Road |
|
8/29/00 1:24 PM |
Wickenburg Police Dispatch |
Told them to expect a flood on Sols Wash, comparable to Nora, at around 4:00 to 5:00 PM today. |
|
8/29/00 2:02 PM |
MCDOT Radio Room |
Alarm at Hassy/Morristown, told her we would need to close Hassy @ Patton Rd. |
|
8/30/00 9:00 AM |
La Paz County Emergency Management |
Told them of a report from field crew of flooded trailers in the Wenden area due to breakout of Centennial Wash. Centennial @ Wenden currently flowing at 3,400 cfs. |
|
8/30/00 10:08 AM |
MCDOT Radio Room |
Report from field crew of damage around SR71 bridge over Centennial Wash, also nearby Railroad bridge, also a heads up for flows coming down the wash past I-10 into Harquhala Valley. |
|
10/10/00 7:02 AM |
Glendale Police Dispatch |
Told them we were measuring 200 cfs at 43rd Ave, but did not expect it to go much higher unless more rain moved in from the west |
|
10/21/00 8:57 PM |
Wickenburg Police Dispatch |
Told them I expected a large flood on Sols given the contributions from Flying E and Hartman. Several other calls both ways as the event progressed. |
|
10/22/00 2:45 AM |
NWS - Phoenix |
Increasing flow in Centennial - suggested a warning for the Wenden area, and alert citizens of possible evacuation. |
|
10/22/00 6:00 AM |
NWS - Phoenix |
Flow in Centennial at 19,000 cfs - pleaded with them to spread word and get people out. |
|
10/22/00 3:00 PM |
MCDOT |
Advised them to monitor or close old US80 by dark - due to waters within Centennial Wash. |
|
10/22/00 3:20 PM |
MCDEM |
Wanted info on any major expenses to FCD as a result of storm. Told him of repeater and ALERT computers - passed info to Tom Johnson next morning (early). |
|
10/22/00 5:30 PM |
Southern Pacific Railroad |
Briefed on expected Centennial Wash flow. |
|
10/23/00 11:00 AM |
CAP |
Centennial Wash about to spill over into CAP if it goes up another 6 inches. Told him wash had probably peaked. |
|
10/24/00 9:00 AM |
MCDEM |
Rains last night causing a flow upper portion of New River (about 1600 cfs). |
|
10/24/00 3:00 PM |
MCDOT |
Centennial Wash flow should reach Old US 80 area around 5 PM. |
|
10/27/00 7:15 AM |
La Paz County Emergency Management |
Briefing - Wash may go to about 1000 cfs, another threat later on - 4000 cfs? |
|
10/27/00 8:55 AM |
La Paz County Emergency Management |
Updated him on weather events - a little flow this morning, a little more later on. |
|
10/27/00 9:00 AM |
La Paz County Emergency Management |
Updated 0715 AM briefing. 2000 cfs this morning? |
|
10/27/00 9:15 AM |
Wickenburg Police Dispatch |
Heavy rain on the way - mainly west side of town? |
|
10/27/00 10:27 AM |
Scottsdale Fire |
Water accumulating behind StoneRidge Dam |
|
10/27/00 10:55 AM |
Wickenburg Police Dispatch |
Already half to one inch into upper reaches of Sols Wash - more to come. |
|
10/27/00 11:15 AM |
MCDOT |
Tiger Wash starting to flow. |
|
10/27/00 11:45 AM |
CAP |
Flow increasing in Centennial - now up to 2600 cfs upstream of concerned area (I-10). |
|
10/27/00 12:15 PM |
NWS at Wenden |
Briefed on happenings. Told him should be some runoff - probably no big deal. |
|
10/27/00 12:40 PM |
Wickenburg Police Dispatch |
.50 to 1.25 inches next 1 to 2 hours many areas. Expect the worse, but probably not quite as bad as few days ago. |
|
10/27/00 4:15 PM |
Wickenburg Police Dispatch |
Weather update. Worse about over? |
|
10/27/00 4:30 PM |
Scottsdale Fire |
Loss of water behind StoneRidge - why? |
|
10/27/00 5:45 PM |
La Paz County Emergency Management |
Briefed on runoff expected. Not sure but rain pattern did not suggest much. |
|
10/27/00 8:00 PM |
MCDOT |
Some minor flows many washes - Agua Fria/Grand, New River/Glendale, New River Dam and Hassayampa at Arlington. |
|
10/27/00 8:30 PM |
NWS - Phoenix |
Briefed them on flows/runoff. |
|
10/27/00 10:30 PM |
NWS - Phoenix |
Updated them on flows/runoff. |
|
10/28/00 12:07 AM |
Wickenburg Police Dispatch |
Briefed them on weather for they're planning purposes, - see no additional or new problems.. |
|
10/28/00 2:30 AM |
NWS - Phoenix |
At Wenden Centennial up to about 3000 cfs - flow increasing rather rapidly. |
|
10/28/00 7:05 AM |
MCDEM |
Told him Centennial Wash had risen from 5000 to 10,000 cfs since 5:00 am, asked him to notify his contact in La Paz County. |
|
10/28/00 7:30 AM |
La Paz County Emergency Management |
Mary Dahl called the ALERT room for status of Centennial, whether it might go up or down or stabilize, told her I did not know at this point. |
|
10/28/00 8:00 AM |
La Paz Co. Public Works |
Called Tammy of Public Works at request of MCDEM, told her how to get 5093 stage data via the web. |
SUMMARY
A number of heavy thunderstorms dropped large amounts of rain in the Wickenburg area, lower Hassayampa and upper Centennial watersheds on August 29th, 2000. These storms caused flooding along several watercourses in northwestern Maricopa County and eastern La Paz County, including Martinez Creek, Sols Wash and Centennial Wash. The storm produced significant runoff events in the Wickenburg area and in the Centennial watershed with estimated return periods of between 8 and 17 years.
The month of October featured a series of Pacific low-pressure frontal systems which tapped tropical moisture in northern Mexico as they passed through the State, resulting in heavy widespread rain with numerous embedded thunderstorms. Again, the Wickenburg and Centennial areas were affected, along with Grass Wash, Tiger Wash, Jackrabbit Wash and much of northern and central Maricopa County. On October 10th, flows in central Phoenix and Scottsdale were generally around a 2-year return period. But the rains from this storms served to wet many watersheds around the County, which added to the runoff potential for subsequent storms. October 27th saw heavy runoff in the northern, central, western and northwestern portions of the County. Centennial Wash experienced what is believed to be a 100-year event, Sols Wash saw a 66-year return period event, Flying E Wash in Wickenburg around a 40, and Hartman and Tiger Washes approximately 16-year events. Flows during the October 27th storm were again heavy in the western and northwestern parts of the County. Jackrabbit Wash experienced a 50-year flood, Hassayampa @ I-10 recorded a 70-year event, Casandro Wash in Wickenburg managed a 40-year, and Sols and Tiger Washes each were treated to 10-year events.
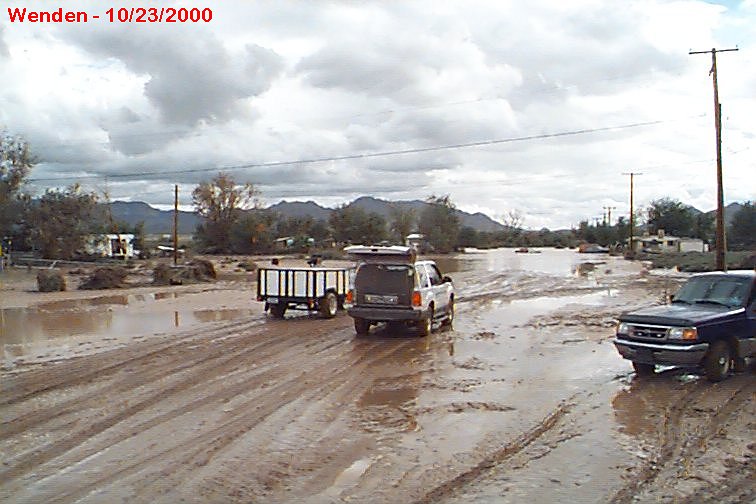
Appendix E contains selected digital photos of flooding from around the County.
Selected Outlook and Message Products from the
Meteorological Services Program
 Flood Control District of Maricopa County
Meteorological Services Program (MSP)
 WEATHER OUTLOOK
Date & Time: Monday, August 28, 2000 1:35 PM MST
Forecaster: Jim Perfrement
Phone: 602-506-8701
SYNOPSIS:
A little rain this morning in spots, nothing really significant. But it shows how moist the atmosphere has become - perhaps more moist than any other time this summer. But cloud cover and relatively cool temperatures hurting the chances of significant rain this afternoon/tonight. Believe there will be some storms but perhaps not much heavy rain. Kinda feel tomorrow afternoon or night may be the biggy. And looking down the road - monsoon may end about Thursday (give or take a day), as very dry air to move in and stay awhile.
At 1:15 PM there were light showers everywhere, though a minimum over MSP area. The strongest storms were over far southwest Maricopa County and southeast of our area - roughly a line from east of Globe down to the Tucson. Movement was generally toward the north or northwest 15 mph.
|
Forecast Zone |
Tonight / Tue A.M. Chance of Rain (%) |
Prime Time |
Maximum Prime Time Amount (in.) |
|
Palo Verde |
40 |
5pm - 1am |
.60 |
|
Rainbow Valley |
40 |
5pm - 1am |
.70 |
|
West Valley |
40 |
6pm - 1am |
.60 |
|
Northwest Valley |
40 |
6pm - 1am |
.60 |
|
Wickenburg |
40 |
5pm - 1am |
.60 |
|
Lake Pleasant |
50 |
5pm - 1am |
.70 |
|
New River/Cave Creek |
50 |
Now - 1am |
.80 |
|
Phoenix |
40 |
6pm - 1am |
.60 |
|
Tempe Town Lake |
40 |
6pm - 1am |
.60 |
|
Southeast Valley |
50 |
5pm - 1am |
.70 |
|
Scottsdale |
50 |
6pm - 1am |
.70 |
|
Lower Salt River Lakes |
50 |
4pm - 1am |
.70 |
|
Superstition |
60 |
4pm - 1am |
.80 |
Flood Control District of Maricopa County
Meteorological Services Program (MSP)
Date & Time: Friday, October 20, 2000 1:30 PM MST
Forecaster: Waters
SYNOPSIS:
Quite pleasant outside right now, temperatures in the mid-80s with very few clouds. Look for a high today around 87 with light winds and some gusts to 15 mph. Tonight will be clear and cool. Should be dry between now and Saturday evening.
Starting Saturday night, we are expecting a Pacific storm which is now moving over San Francisco, to slide into the MSP zones. This storm has reasonable moisture with it, and will pull in additional moisture from yesterday's storm which remains over SE AZ and northern Mexico. This will combine to cause a significant rain event for this time of year, possibly an inch on the deserts and 2 inches in the mountains. Luckily, the warm air that caused embedded thunderstorms and lots of lightning yesterday will not be present, and we can expect a more winter-like rain of long duration and low intensity. This storm could cause intermittent showers through Tuesday morning.
If conditions warrant we will produce a forecast/products on Sunday.
|
Forecast Zone |
Tonight / Sat A.M. Chance of Rain (%) |
Prime Time |
Maximum Prime Time Amount (in.) |
|
Palo Verde |
|
|
|
|
Rainbow Valley |
N |
|
|
|
West Valley |
|
|
|
|
Northwest Valley |
O |
|
|
|
Wickenburg |
|
|
|
|
Lake Pleasant |
N |
|
|
|
New River/Cave Creek |
|
|
|
|
Phoenix |
E |
|
|
|
Tempe Town Lake |
|
|
|
|
Southeast Valley |
|
|
|
|
Scottsdale |
|
|
|
|
Lower Salt River Lakes |
|
|
|
|
Superstition |
|
|
|
Flood Control District of Maricopa County
Meteorological Services Program (MSP)
WEATHER OUTLOOK
Date & Time: Saturday, October 21, 2000 1:10 PM MST
Forecaster: Jim Perfrement
SYNOPSIS:
Think wet - very wet. This outlook will also be a heads up, or flash flood watch, regarding expected weather conditions. Storm action plans should be looked at - as the odds are good this storm will result in locally (at least) runoff. Be prepared!
A few showers have already taken place over portions of the MSP area - all light. And at 12:45 PM radar showed scattered light to moderate showers and thunderstorms developing over southwest Maricopa county - from northwest of Gila Bend to east of Gila Bend. Movement was toward the northeast about 15 mph.
Although rain will be taking place this afternoon and evening I believe the main event will be from late tonight through Sunday night. If the guidance is anywhere near correct some MSP areas should get an inch to 1.5 inches. And there will be additional rain, at times, lasting through Monday and possibly as long as Tuesday morning. Again, be prepared.
It will also be very cool the next few days, with afternoon highs ranging from the upper 60s to middle 70s. And it will be breezy.
I will be in the office Sunday (possibly late tonight if it gets nasty).
|
Forecast Zone |
Tonight / Sun A.M. Chance of Rain (%) |
Prime Time |
Maximum Prime Time Amount (in.) |
|
Palo Verde |
|
|
|
|
Rainbow Valley |
|
|
|
|
West Valley |
A |
|
|
|
Northwest Valley |
B |
2 AM |
. 25 |
|
Wickenburg |
O |
|
|
|
Lake Pleasant |
U |
T |
|
|
New River/Cave Creek |
T |
O |
TO |
|
Phoenix |
|
|
|
|
Tempe Town Lake |
100 |
NOON |
|
|
Southeast Valley |
% |
|
. 50 |
|
Scottsdale |
|
|
|
|
Lower Salt River Lakes |
|
|
|
|
Superstition |
|
|
|
Flood Control District of Maricopa County
Meteorological Services Program (MSP)
Message 1
Alert
Date & Time: Saturday, October 21, 2000 11:40 PM MST
Forecaster: Jim Perfrement
Phone: 602-506-8701
Comments:
Time to update everyone on weather events. As for this past evening - business was done by phone to areas that received significant rain - resulted in flooding of washes/roads. It appears the hardest hit area was Wickenburg, and areas to the west and north of Wickenburg. Rainfall was generally from 1 to 3 inches. At 11 PM there was a significant flow in the Hassayampa River moving south from Wickenburg that will probably result in the closing of Patton Road in an hour or two(MCDOT give me a call for details).
Another area of concern was Rainbow Valley, as locally heavy rain caused Waterman Wash to flow. Overall, there was a lot more rain than expected for the evening hours. And more is to come.
At 11:30 PM very little rain was being reported over the southern portion of the MSP area. But there were still scattered light to moderate showers and thunderstorms over northern sections - but at most locations not as much rain as earlier in the evening. And for the most part additional rain the next couple of hours will not be sufficient to result in significant additional flooding - just retard the drying process.
But more rain is on the way - possibly a lot more rain. Radar shows activity developing over La Paz and Yuma county - moving north and east. And numerical guidance suggests rains of well over an inch may fall later this coming day - with additional amounts Sunday night and into Monday. So stay tuned.
I will be at the above phone number for the remainder of the night, and will update the weather picture as additional information becomes available.
This message is not intended for public dissemination. Please pass this information along to appropriate emergency response organizations (police, fire, transportation, etc.) you support. Also, please take appropriate actions to prepare for possible flooding.
Flood Control District of Maricopa County
Meteorological Services Program (MSP)
WEATHER OUTLOOK
Date & Time: Thursday, October 26, 2000 1:00 PM MST
Forecaster: Jim Perfrement
SYNOPSIS:
More weather disturbances on the way - main periods appear to be Friday (probably afternoon) through Friday night, then Monday, and then again late in the week. For now will only discuss the next two. The atmosphere remains rather moist from the storm this past weekend - more importantly the ground is also very moist. And due to saturated soil conditions additional rain will mostly become runoff. In other words - a situation than could lead to additional flooding.
On a more positive note this next disturbance should not linger over our area like the past one did. It should be east of the MSP area by late Saturday. The big question is - how much rain will fall until then? Right now I would place the average storm total in the .50 to .75 inch bracket, enough to cause many washes and creeks to once again flow - though overall not to levels of past storm. But there could be higher rain accumulations, over an inch, especially over the higher terrain of the MSP area - so once again stand by.
The weather disturbance forecast to arrive Sunday night and/or Monday is forecast to track a little farther north. If so the main impact (heavy rain) should be north of the MSP area, though very possibly some showers our area.
Temperatures will remain below normal through the weekend, and it may become locally very breezy at times.
|
Forecast Zone |
Tonight / Fri A.M. Chance of Rain (%) |
Prime Time |
Maximum Prime Time Amount (in.) |
|
Palo Verde |
60 |
3am - noon |
. 40 |
|
Rainbow Valley |
" |
" |
" |
|
West Valley |
" |
" |
" |
|
Northwest Valley |
" |
" |
" |
|
Wickenburg |
" |
" |
" |
|
Lake Pleasant |
" |
" |
" |
|
New River/Cave Creek |
" |
" |
" |
|
Phoenix |
" |
" |
" |
|
Tempe Town Lake |
" |
" |
" |
|
Southeast Valley |
" |
" |
" |
|
Scottsdale |
" |
" |
" |
|
Lower Salt River Lakes |
" |
" |
" |
|
Superstition |
" |
" |
" |
Flood Control District of Maricopa County
Meteorological Services Program (MSP)
Message 3
Flash Flood
Warning
Date & Time: Friday, October 27, 2000 12:55 PM MST
Forecaster: Jim Perfrement
Phone: 602-506-8701
Forecast Zone
|
Palo Verde |
|
Phoenix |
|
|
Rainbow Valley |
|
Tempe Town Lake |
|
|
West Valley |
|
Southeast Valley |
|
|
Northwest Valley |
|
Scottsdale |
|
|
Wickenburg |
X |
Lower Salt River Lakes |
|
|
Lake Pleasant |
|
Superstition |
|
|
New Rvr/Cave Creek |
|
|
|
This warning is valid Now to 5:00 PM MST.
Comments:
Strong thunderstorms have moved into the Wickenburg area - rain accumulation rate of an inch an hour some areas. As ground is saturated all this will result in runoff. At 12:45 the heaviest rain was over southern portions of the town, but will spread through most areas the next half to one hour.
Take precautions.
Note: A Flash Flood Warning is issued when it appears flooding is imminent - usually within 30 minutes of the statement.
This message is not intended for public dissemination.
Please expedite this information to affected emergency response organizations (police, fire, transportation, etc.) within your area.
Also, please take appropriate actions to prepare for possible flooding.
Further information will be provided as it becomes available.
Flood Control District of Maricopa County
Meteorological Services Program (MSP)
Message 3
Flash Flood
Warning
Date & Time: Friday, October 27, 2000 1:50 PM MST
Forecaster: Jim Perfrement
Phone: 602-506-8701
Forecast Zone
|
Palo Verde |
|
Phoenix |
X |
|
Rainbow Valley |
X |
Tempe Town Lake |
X |
|
West Valley |
X |
Southeast Valley |
|
|
Northwest Valley |
X |
Scottsdale |
|
|
Wickenburg |
|
Lower Salt River Lakes |
|
|
Lake Pleasant |
|
Superstition |
|
|
New Rvr/Cave Creek |
X |
|
|
This warning is valid Now to 4:00 PM MST.
Comments:
Updated to included Phoenix, Tempe Town Lake and Rainbow Valley zones. Sorry about that.
Strong thunderstorms have moved into the warning area. Movement was toward the northeast about 30 mph. Rain accumulation from this band of storms was locally over an inch an hour. This will result in flash flooding.
Take precautions.
Note: A Flash Flood Warning is issued when it appears flooding is imminent - usually within 30 minutes of the statement.
This message is not intended for public dissemination.
Please expedite this information to affected emergency response organizations (police, fire, transportation, etc.) within your area.
Also, please take appropriate actions to prepare for possible flooding.
Further information will be provided as it becomes available.
Point Rainfall Maps and
Isohyetal Rainfall Coverage Maps
from FCD Automated Gage Data
August 29th, 2000
October 10th, 2000
October 21st - 23rd, 2000

October 27th, 2000


NEXRAD Radar Reflectivity /alert/102000/Images
From Phoenix WFO
Storm-Total Precipitation Map for 08/26/00 11:07 through 08/29/00 13:00 MST

1-hour Precipitation Map ending 10/21/00 at 18:00 MST
Storm-Total Precipitation Map for 10/20/00 14:47 through 10/22/00 00:00 MST
3-hour Precipitation Map ending 10/27/00 at 12:00 MST
Storm-Total Precipitation Map for 10/26/00 17:15 through 10/27/00 17:00 MST
Depth/Duration/Frequency Plots and Histograms
for Seven Selected Stations


APPENDIX E
Selected Digital Photos
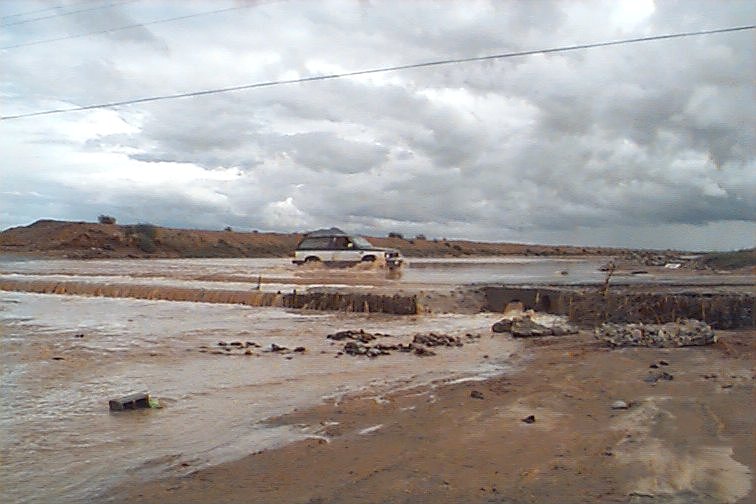
Big No-No on Centennial Wash @ Eagle Eye Road near Aguila, 10/23/2000
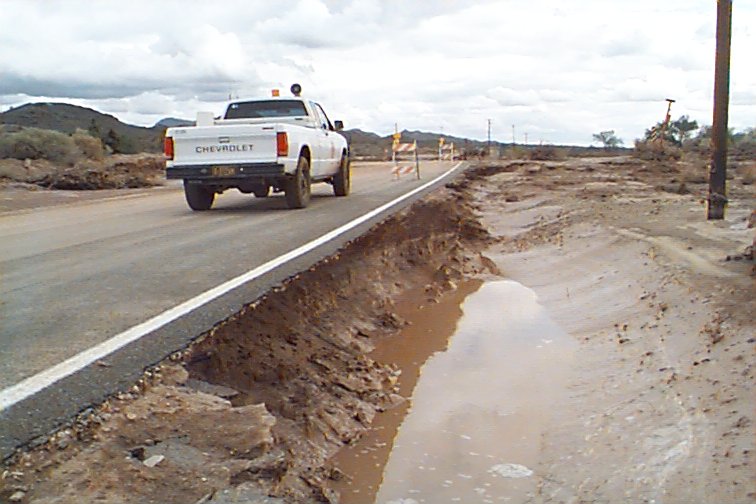
Centennial Wash @ Harquahala Valley Road - 10/23/2000
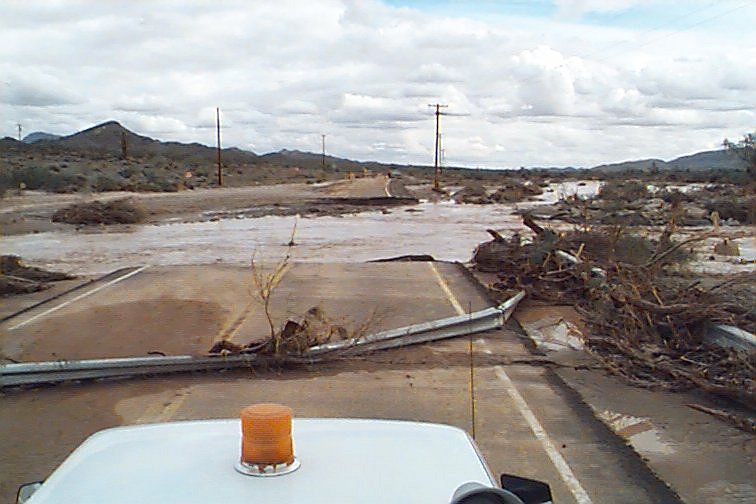
Centennial Wash @ Salome Road - 10/23/2000

FCD crew taking a flow measurement on the US 60 Bridge over the Hassayampa River
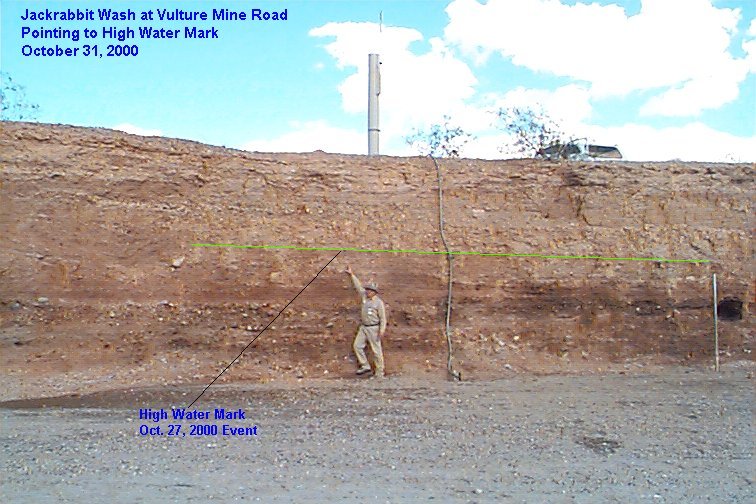
High-water mark, Jackrabbit Wash near the intersection of Wickenburg and Vulture Mine Roads, caused by the flood of 10/27/2000. The gage was installed on the 31st and not in service during the flood.
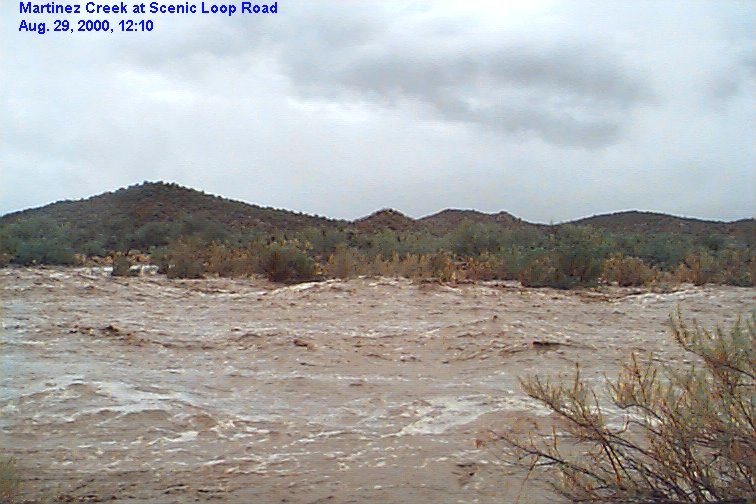
Martinez Creek at Scenic Loop Rd., Aug. 29, 2000 at 12:10, note large standing waves
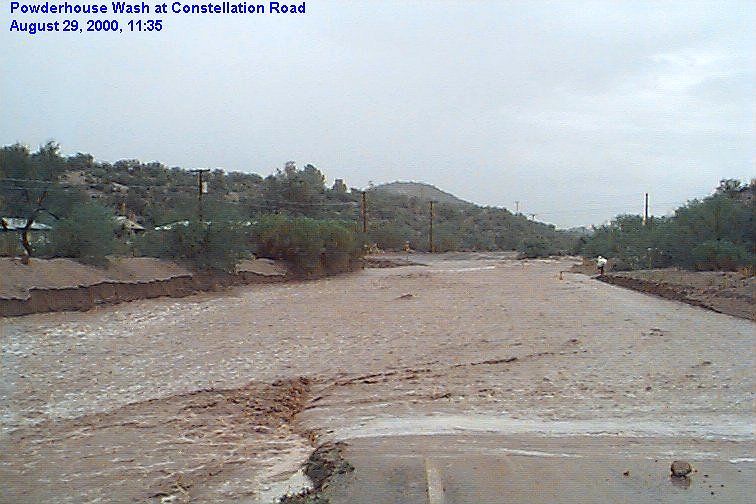
Powderhouse Wash at Constellation Road, Aug. 29, 2000 at 11:35
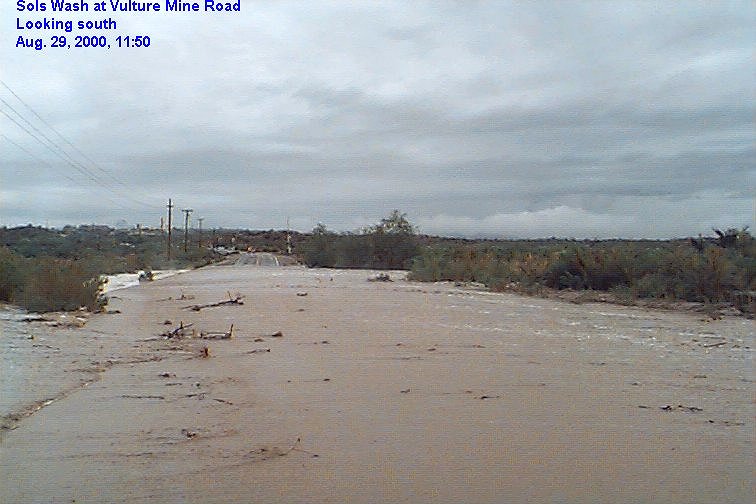
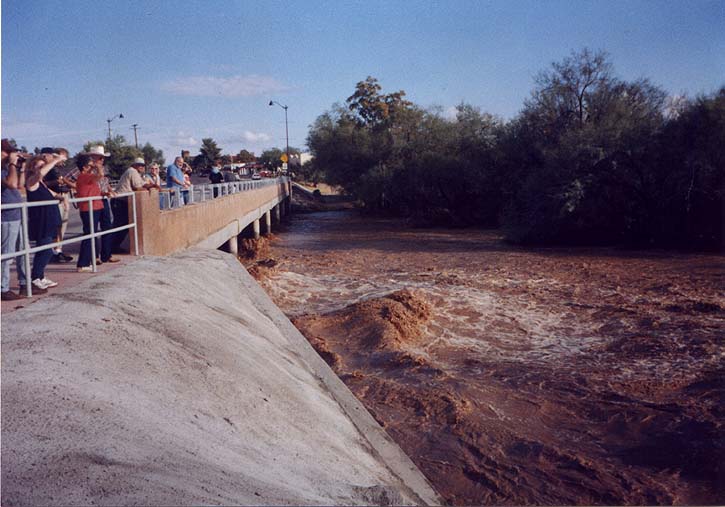
Sols Wash at Vulture Mine Road, view to south, Aug. 29, 2000 at 11:50