STORM REPORT
Late Monsoon Storms of 2003
in the Upper Trilby Wash
Watershed
August 26th-27th and
September 6th, 2003

![]()
SECTIONS
--------------------
![]()
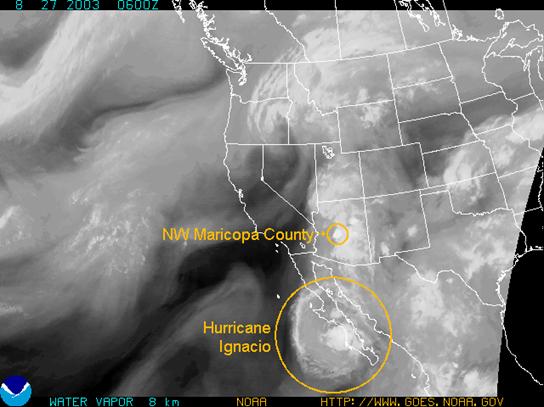
Figure 1
Figure
1 above tells the story of the August 26-27 rainfall event. It is a GOES-8 water-vapor image of the
western U.S. taken on August 26th at 11:00 PM. Hurricane Ignacio is clearly visible in it’s
dying stages over the southern Baja peninsula.
Moisture from the hurricane is entrained in the monsoon flow, traveling
northward through Mexico, Arizona and Utah.
The triggers to produce storms are a combination of daytime heating and
upper-air disturbances traveling around the low-pressure system seen in this
picture over eastern Oregon. The very
moist and cold clouds responsible for the northwest Maricopa County rainfall
are clearly visible as the bright spot within the smaller gold circle.
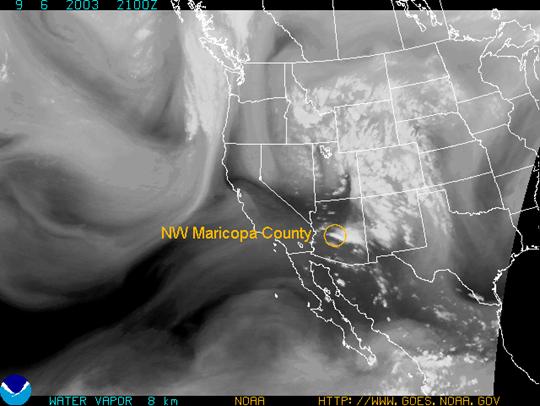
Figure 2
Figure
2 is a GOES-8 water-vapor image showing the storm over northwest Maricopa County
on September 6th, 2003 at 2:00 PM.
A gulf-surge (low-level moisture from the Gulf of California moving
north into Arizona) on Sep. 4th served to moisten the lower
atmosphere, and another around midnight on the 6th added even more
moisture. On the afternoon of the 6th,
colder and somewhat drier air moved into northwest Maricopa County from the
north and northwest. Combined with
daytime heating, the colder airmass served to lift the moist, warm layer in the
valley, causing a line of thunderstorms to form as seen in the gold circle
above. Storms formed along the line, and
were driven by mid-level winds toward the southeast. Several storms formed in sequence in the area
between State Route 74 and the northern County border east of Morristown and
west of Lake Pleasant.
![]()
The Flood Control
District has at it’s disposal four methods of estimating precipitation. They will be examined in the order listed.
·
Satellite Precipitation Estimates
·
NexRain® Gage-Adjusted Radar Estimates
Figure 3
Figure 3 is from the
National Oceanic and Atmospheric Administration’s National Environmental
Satellite, Data and Information Service, Satellite Analysis Branch. Cloud temperatures are estimated by the GOES
satellite every 15 minutes, and from these rainfall rates are inferred. Corrections are applied to the rates based on
the angle of view (parallax), moisture, orographics and others. The time period listed for this estimate is
from August 26th, 2003 at 11:00 PM through August 27th,
2003 at 1:00 AM. The maximum estimates
are in the range of 3 to 3.5 inches.
However, the parallax correction appears to be off, as the peak rainfall
areas are east of Lake Pleasant. We will
see from the next three methods of precipitation estimation that this was
indeed the case. This product is in it’s
infancy and is only available on an event basis as chosen by the NOAA
staff. A satellite estimate of the
September 6th storm was not available.
Figure 4
Figure 4 shows the rainfall
amounts transmitted by Flood Control District rain gages for the 3-hour period
between August 26th at 11:03 PM and August 27th at 01:03
AM, 2003. Of note is the 3.15 inches
reported by the gage at Circle City.
This total was verified by (1) unofficial gage measurements by two
Circle City residents, and (2) a field visit to the gage to test operation and
calibration.
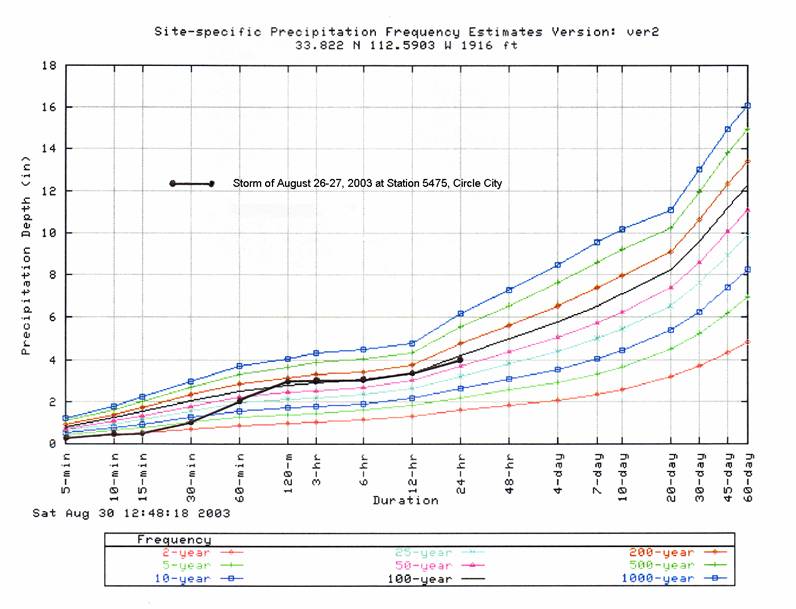
Figure 5
Figure 5 is a graph of
precipitation depth vs. duration from the NOAA 14 Rainfall Atlas for the Circle
City site. The measured storm rainfall
for the Circle City gage is plotted as the heavy black line. The storm at this point could be considered a
150-year, 2-hour event; or a 125-year, 3-hour event; or a 100-year, 6-hour
event. For the 3-hour duration, this
storm ranks a 6.5 on the Haestad Storm Severity Index (a 1-10 scale of storm
severity).
Figure 6
Figure 6 shows the
rainfall amounts transmitted by Flood Control District rain gages for the
3-hour period between 1:07 and 4:07 PM, on September 6th, 2003. There are no rainfall amounts of note except
for the 1.38 inches at Castle Hot Springs.
We will see from the radar estimates that much of the storm volume fell
between the gages – south of Castle Hot Springs and north of Wittmann.
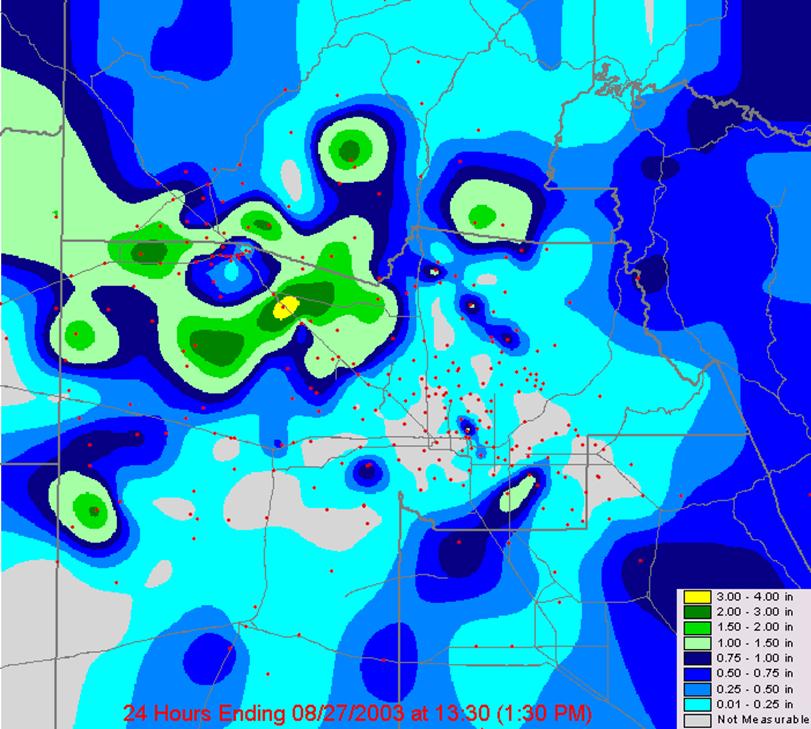
Figure 7
Figure 7 represents the
storm total rainfall collected by the Flood Control District automated rain
gages for the 1-day period ending 8/27/03 at 1:30 PM. The map was created using ESRI Spatial
Analyst® to interpolate surfaces of equal rainfall depth between the
gages. The gage at the center of the
yellow ellipse is Circle City. This type
of map was not created for the September 6th storm because, as noted
in Figure 5, the gages didn’t measure the highest rainfall areas.
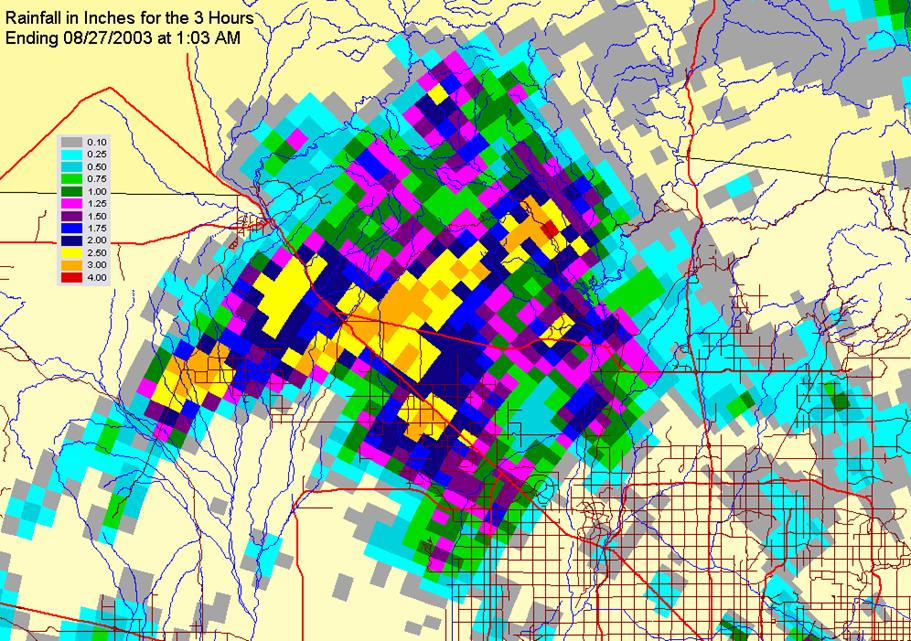
Figure 8
Nexrad (Next Generation
Radar) radar estimates are produced by translating radar reflection into a
rainfall rate, then accumulating the reflected radar energy over a given
point. It tends to be most accurate when
the atmosphere is very moist, which was the case during this storm. Figure 8 above shows the accumulated estimate
for the 3-hour period between August 26th at 11:03 PM and August 27th
at 01:03 AM, 2003. This is the same time
period as Figure 4. It was created by
converting the rainfall image to a shape file, and adding it to a GIS project
file along with roads, streams and the county boundary. The figure shows a large area of rain greater
than 2.5 inches east of Morristown over the watersheds that feed Wittmann
Wash. Also shown is a large area of rain
greater than 2 inches west of the Hassayampa River and north of Patton
Road. This helps explain the flow in the
Hassayampa River at Patton Road when very little flow was measured at the
Morristown gage.
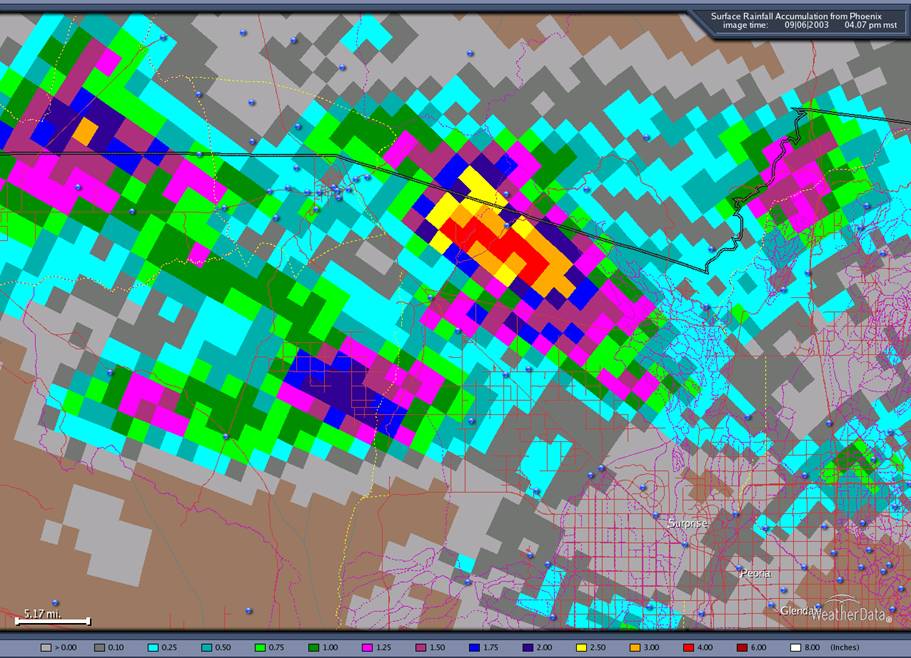
Figure 9
Figure 9 is an image saved from our WeatherData SmartWarn® radar system. The colors represent an estimate of the accumulated rainfall for the 3-hour period ending September 6th, 2003 at 4:07 PM. It indicates that the area south of the County boundary and north of SR 74, again the watershed that feeds Wittmann Wash, received very heavy rain - some areas in the 4 to 6 inch range. Other heavy rainfall areas include the Star Wash and Upper Centennial Wash watersheds. ALERT rain gages are shown on the map as blue dots.
NexRain® Gage-Adjusted Radar Estimates
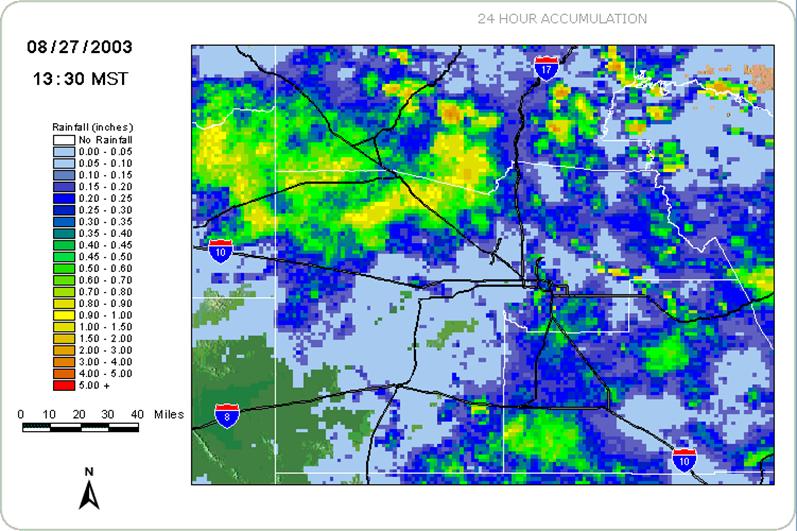
Figure 10
The Flood Control District contracts with NexRain®, Inc. to provide gage-adjusted radar rainfall estimates. The products are provided via the internet in real-time. Each pixel on the above Figure 10 is assigned a cell in a spreadsheet. Every five minutes, the radar rainfall estimates are read into each cell. Data from all the automated rain gages are read into the spreadsheet cells that correspond to their location. The radar-derived depths are compared to the gage depths at each of the gage cells, and a ratio is computed for all the gage cells. This ratio is then used to skew the radar value at every cell in the spreadsheet, and a map is produced from the new values at all cells. This process can raise or lower the radar estimates based on ground-truth data, but tends to “average out” high and low values like the 3.15 inches recorded in a 3-hour period at the Circle City gage. The map above covers the time from 1:30 on August 26th through 1:30 on the 27th. The highest rainfall values in the area north of Wittmann and Circle City are in the 1.0 to 1.5 inch range.
![]()
Runoff measured at the automated stream gages in the Trilby Wash watershed above McMicken Dam can at best be characterized as minimal. Upper Trilby Wash, on Trilby Wash north of Castle Hot Springs Road, received less than an inch of rain for both storms and measured no runoff. McMicken Dam measured peak stage values of 2.7 feet on August 27th at 5:40 AM and 0.8 feet on September 6th at 10:28 PM. McMicken Floodway recorded a flow of 213 cfs on August 27th at 8:27 AM.
A slope-area computation was conducted on September 8th, 2003 in the engineered section of Wittmann Wash, approximately 500 feet downstream of the US 60 eastbound bridge. Water marks from the August 26-27 storm were flagged in four cross sections. Water marks from the September 6th storms were observed to be “about half the height” of the August marks. The computation produced a discharge estimate of 965 cfs for the August 26-27 storm.
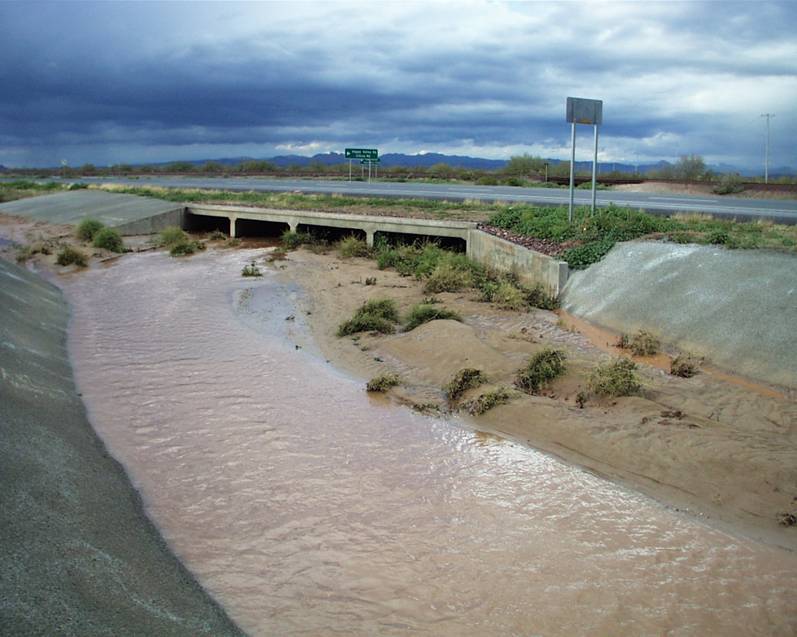
Figure 11 – Unknown Wash south of US 60 in the Wittmann Area